Product Reviews
Exploiting the HTML5 Canvas with jqChart
jqChart for ASP.NET MVC leverages HTML5 to deliver more responsive, scalable charting to the browser -- and throws in an HTML helper for ASP.NET MVC developers.
One of the earliest HTML5 tools to be widely implemented in browsers is the canvas, which provides both a platform-independent way to develop complex graphics and a standard JavaScript API for creating them. jqChart, a jQuery plug-in, takes advantage of canvas to deliver client-side charting. Client-side tools allow you to deliver more responsive, scalable applications by generating the chart using the user's CPU instead of your server's (a shared resource). With client-side charting, instead of shipping a bulky image to the browser, only the required data must be sent to the browser.
This is what jqChart does, generating everything from the simple bar chart shown in Figure 1 to complex financial charts (including overlaying multiple chart types). jqChart also takes care of generating legends and labels for you and even fires events as users move their mouse over the chart's data points. jqChart's data structure is simple (an array of objects representing the data points to be graphed), making it easy to format data for charting. I tested jqChart in several browsers and found the results to be virtually identical in all of them. Unfortunately, while the documentation suggests that tooltips will be generated for a chart's data points, I didn't get any.
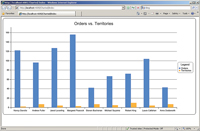
[Click on image for larger view.] |
| Figure 1. You can generate a bar chart at the client by passing jqChart an array of values, with each position representing a data point. |
After the initial chart is displayed, client-side charting should let you respond to the user's inputs. This requires a charting tool that makes it easy to modify an existing chart, which is where jqChart let me down. In my testing, I found that I needed to regenerate the complete chart to make virtually any change, including just updating the chart title.
jqChart for ASP.NET MVC includes an HTML extension method you can use in your Views to write .NET code that will generate jqChart JavaScript at runtime. Unfortunately, the helper embeds all of your settings into the code that will generate the chart. A more useful version would separate the settings from the chart code to support changing the chart on the fly in the browser.
ASP.NET MVC Helper
The jqChart for ASP.NET MVC installation package includes two JavaScript libraries you must add to your application to integrate the jqChart jQuery plug-in. To use the ASP.NET MVC helper, you'll also need to add references to a DLL (libraries for both MVC 2 and MVC 3 are included). And, after that, you're pretty much on your own when it comes to using the HTML helper. The jqChart site has documentation for the jQuery plug-in but none for the MVC helper -- you're going to have to rely on the samples on the Web site and IntelliSense.
What I found missing in jqChart was the ability to easily manipulate the original chart after it's displayed in the browser. This isn't a fatal flaw -- it just means that I have to determine my users' scenarios in advance and add more code than I'd like to support those scenarios, especially if I want to support adding or removing a data series. However, it prevents jqChart from being as flexible a tool as I would want in a client-side charting solution.
jqChart for ASP.NET MVC
Web: jqchart.com
Price: $299 (developer license only), $499 (license with subscription and priority support)
Quick Facts: A client-side, jQuery plug-in for generating charts using the HTML5 Canvas; includes an HTML helper for both Razor and ASPX environments
Pros: Supports a wide variety of chart types with the ability to generate complex graphs simply
Cons: Changing a chart requires regenerating the whole chart rather than setting the appropriate property
About the Author
Peter Vogel is a system architect and principal in PH&V Information Services. PH&V provides full-stack consulting from UX design through object modeling to database design. Peter tweets about his VSM columns with the hashtag #vogelarticles. His blog posts on user experience design can be found at http://blog.learningtree.com/tag/ui/.