In-Depth
Integrating Bing Maps With WPF
Bing Maps moves beyond Silverlight and AJAX with the new native WPF Control, which enables you to build interactive tools for visualizing geographical data on the desktop.
Released in January, version 1 of the Bing Maps Windows Presentation Foundation (WPF) Control allows you to integrate mapping functionality directly into WPF applications. The downloadable SDK, which contains the library binaries and programming reference, provides some good examples to get you up and running, but moving beyond the sample code requires a bit more effort. In this article, I'll present additional examples that you can adapt to produce beautiful, interactive visualizations of geographical data.
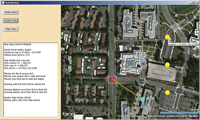
The best way to see where I'm headed is to take a look at Figure 1. It shows a demo WPF application with a Bing Maps Map control, three Button controls and a ListBox control. After the application launched and the embedded Bing Maps map object was initialized to a view of the entire globe, I clicked on the first button labeled Center-Zoom. This programmatically centered the map to latitude 47.6421 and longitude -122.1420 (which is the location of the building where I work in Redmond, Wash.) and then zoomed the map view in to a level of 17.
[Click on image for larger view.] |
| Figure 1. A new control/library allows developers to add Bing Maps functionality to a WPF application. |
Next, I double-clicked on the map in the traffic intersection near the middle of the map. Behind the scenes the application fetched the XY coordinates of the mouse click within the WPF application window, computed the XY coordinates within the map, and determined the corresponding latitude and longitude of the click. Then the application placed a red marker dot on the map at the exact location of the double-click, and two blue marker dots to the right of the double-click. As each dot was added to the map, the latitude and longitude coordinates were stored with it. Then the application connected the first red dot to the two blue dots using a solid orange straight line and two dashed purple curved lines.
Next, I clicked on the button labeled Display Data. The code in the associated event handler read a tiny data source of three items that had latitude and longitude information, and then displayed those three data items as yellow marker dots. Notice that my mouse is hovering over the top-most yellow dot (the mouse pointer wasn't captured by my keyboard PrtScn so I pasted in a fake icon image) and the location of the dot is displayed in a ToolTip box.
In the sections that follow I'll walk you through the code that produced the screenshot in Figure 1. I'll also offer some advice on when to use WPF and when to use a Web-based approach. With this knowledge, you'll be able to extend my demo program and create sophisticated visualizations using your own geographical data.
Setting up the Application
To begin, launch any version of Visual Studio that contains the Microsoft .NET Framework 4 and the Windows SDK. You might need Administrator privileges, depending on your environment. If you're currently using an older version of Visual Studio, you can download a free edition of Visual Studio 2010 Express, which contains these prerequisites. Your development machine must be able to connect to the Internet so the map control in your WPF application can access the Bing Maps servers. You also need a Bing Maps key; you can get one for free from the Bing Maps Account Center. Finally, you need the Bing Maps WPF Control from the Microsoft download site. A default installation will likely place the single library DLL in the C:\Program Files (x86)\Bing Maps WPF Control\V1\Libraries directory, but you can place the DLL elsewhere if you wish.
After Visual Studio launches, click File | New | Project and then select the C# WPF Application template and specify a Location (such as C:\BingMapsAndWPF) and a Name (such as Demo). Make sure you have the .NET Framework 4 library selected from the dropdown menu at the top of the New Project dialog box. After your project is created, right-click on the bolded project name in the Solution Explorer window, select Add Reference from the context menu, and then use the Browse tab to go to the Microsoft.Maps.MapControl.WPF.dll library and click OK.
In the file MainWindow.xaml, add the following XML namespace reference below the template-generated xmlns namespace entries:
xmlns:m="clr-namespace:Microsoft.Maps.MapControl.WPF;assembly=
  Microsoft.Maps.MapControl.WPF"
Next, increase the size of the overall WPF Window by setting the Height attribute to 600 and the Width attribute to 1,000. Now you can insert the Bing Maps map by placing this code between the <Grid> and </Grid> tags:
<m:Map x:Name="myMap" CredentialsProvider="YourKeyGoesHere" Mode="Aerial"
  Margin="300,0,0,0"/>
The x:Name attribute can be any legal identifier, but "myMap" is a reasonable choice. Notice that I set a Margin of "300,0,0,0" to provide 300 pixels of non-map control space on the left edge of the main WPF window. I changed the default background color of my Grid container by adding a Background="Wheat" attribute. At this point you should test your application by hitting the F5 key to build and launch the app; a lot can go wrong and it's always better to find errors sooner rather than later.
To finish setting up the application, drag three Button controls from the Toolbox window onto the WPF design surface. Change their Content properties to Center-Zoom, Display Data and Clear Map. Drag a ListBox control onto the design surface and resize it so that it's large enough to display messages.
Changing the Map Properties
You can dynamically change several Bing Maps WPF map control properties, including the Center Location, ZoomLevel and View Mode. In the design view of MainWindow.xaml, double-click on the button1 control to automatically generate the control's click handler and switch your view to the code view of the MainWin-dow.xal.cs file. First, modify the MainWindow constructor:
public MainWindow()
{
  InitializeComponent();
  myMap.MouseDoubleClick += map_MouseDoubleClick;
  listBox1.Items.Add("Bing Maps control initialized");
  listBox1.Items.Add("");
}
If you refer back to Figure 1, you'll see that the program can capture double-click events, so you must add a custom event handler. At this point Visual Studio will complain that method map_MouseDoubleClick doesn't exist, so go ahead and add it:
private void map_MouseDoubleClick(object sender, MouseButtonEventArgs e)
{
  // TODO
}
A key concept when working with the Bing Maps WPF control is the Location class. In order to access it in your program, add the following code to the list of using statements in file MainWindow.xaml.cs:
using Microsoft.Maps.MapControl.WPF;
The essential thing to remember about a Location object is that it has a Latitude property and a Longitude property, in that order. Latitude values range between -90.0 and +90.0 and correspond to Y values (up-down). Longitude values range between -180.0 and +180.0 and correspond to X values (left-right). Location objects also have an Altitude property (which you can ignore).
Next, add the following code to the button1 click handler:
private void button1_Click(object sender, RoutedEventArgs e)
{
  listBox1.Items.Add("Center-Zoom button clicked");
  listBox1.Items.Add("Centering map to 47.6421, -122.1420");
  listBox1.Items.Add("Setting zoom level to 17.0");
  listBox1.Items.Add("");
  myMap.Center = new Location(47.6421, -122.1420);
  myMap.ZoomLevel = 17.0;
}
Remember that myMap is the x:Name of the Map control. Setting the Center and ZoomLevel properties should be self-explanatory. Other useful properties are the Mode, so you can switch between AerialMode and RoadMode, and Heading, so you can adjust the map orientation. At this point you can test your app to verify the button1 control event handler works as expected.
Placing Marker Dots
The Bing Maps WPF Control documentation shows you how to place pushpin controls onto a map. You can use pushpins to represent geographical data points and, often, that's a good choice. However, there are many situations where you'd just like a simple dot. Listing 1 presents code to place a colored marker dot on a Map control.
The helper method accepts a Location that indicates where to place the center of a marker dot, and a Color for the dot. The method begins by creating a blank Ellipse object. One of the neat things about combining Bing Maps and WPF is that you have access to a wide range of shapes such as the Ellipse class. Here the dot radius is hardcoded to 12 pixels; you might want to parameterize that value. The method uses a ToolTip object to store the location of the dot so that when a user hovers the mouse over the dot, the location information will automatically pop up. Nice and easy! Next, the PlaceDot method uses the LocationToViewportPoint method to convert a Location to a Point. The resulting Point is used to create a second Point that's moved to the left and up. The idea is that Ellipse objects are displayed using the upper-left corner of the object's bounding box, so by offsetting by a factor of the radius, the Ellipse will be centered at the location parameter. The ViewportPointToLocation method creates the modified location. To actually place the dot on the map, the static MapLayer.SetPosition method and the instance Children.Add method are used. The paradigm to place a shape on a map seemed a bit odd to me at first, but I quickly got used to it.
Drawing Straight Lines
In some scenarios you might want to draw a straight line between two locations on a map. One way to do it is shown in the following code:
private void DrawLine(Location start, Location finish)
{
  LocationCollectioncoll = new LocationCollection();
  coll.Add(start);
  coll.Add(finish);
  MapPolyline line = new MapPolyline();
  line.Stroke = new SolidColorBrush(Colors.Orange);
  line.StrokeThickness = 3.0;
  line.Locations = coll;
  myMap.Children.Add(line);
}
The DrawLine helper method accepts start Location and finish Location parameters. When you're dealing with Map controls, it's generally best to work with Location objects rather than Point objects (as you normally would in WPF applications). The Bing Maps WPF Control library provides you with a MapPolyline class that works with Location objects. You can think of MapPolyline as a cousin to the WPF Polyline class that works with Point objects. DrawLine has hardcoded values for color and thickness; you might want to parameterize them.
Drawing Curved Lines
Drawing a curved line between two locations on a map is quite difficult. The approach I prefer is to use Bezier curves. Listing 2 presents a fairly sophisticated method that will draw a curve between two Location objects on a map.
A complete explanation of Bezier curves could fill an entire article, but there are only a few things you need to know to modify my code to meet your own needs. For the StrokeDashArray property values I use { 5, 2 } to draw a dashed line where the dashes are 5 pixels long and the space between dashes is 2 pixels long. Much of the code in method DrawCurve uses the start Location and the finish Location to compute a so-called control point that determines the curvature of the Bezier curve. If you experiment with variables xScale and yScale you'll affect the curvature -- larger values of xScale produce more left-right bend and smaller values produce less left-right bend. The yScale variable controls up-down bend.
The method constructs a curve as a set of straight lines. The number of line segments is specified by variable numSegments, which is hard-coded to 31. More segments produce a smoother curve at the expense of performance. Notice that the for-loop in Listing 2 works with type double. In order to keep my code simple I don't perform robust computations, and because of rounding errors, some values of numSegments (for example, 20) will cause the Bezier curve to stop slightly before the specified finish Location. If you use my code in a production setting and modify the value of numSegments, be sure to check that you get correct behavior.
Handling Double-Click Events
With helper methods to place marker dots, draw straight lines and draw curved lines in hand, you can handle double-click events as shown in Figure 1. You already set up the skeleton of the double-click event handler but did not supply the implementation. The code is presented in Listing 3.
Setting e.Handled to true disables the default map double-click behavior, which is to zoom in. Because this is a custom event handler, the GetPosition method returns the XY screen coordinates of the double-click relative to the main WPF window, not the Map control. Therefore you have to subtract 300 pixels from the X coordinate to take into account the left margin of 300 pixels. After placing a red marker dot at the exact location of the double-click, a blue marker dot is placed 150 pixels to the right and 100 pixels down from the red dot. Then a second blue dot is placed to the right, but higher than the red dot. The DrawLine method places a solid orange line between the red dot and the first blue dot. The DrawCurve method is used to draw two dashed curves between the red dot and the second blue dot. Notice that by changing the start-finish order of the Location parameters to DrawCurve, you can produce a curve that bends up or down.
Displaying Multiple Data Points
In Visual Studio, switch back to the design view of the MainWindow.xaml file and double-click on the Button control labeled Display Data. This will generate the skeleton for the button's click event handler and bring you to that code in the file MainWindow.xaml.cs. Edit the code to get:
private void button2_Click(object sender, RoutedEventArgs e)
{
  listBox1.Items.Add("Display Data button clicked");
  listBox1.Items.Add("Placing yellow dots from data source");
  double[][] data = new double[3][];
  data[0] = new double[] { 111, 47.643, -122.140 };
  data[1] = new double[] { 222, 47.642, -122.140 };
  data[2] = new double[] { 333, 47.641, -122.140 };

  for (int i = 0; i <data.Length; ++i)
    PlaceDot(new Location(data[i][1], data[i][2]), Colors.Yellow);
}
This code is intended to illustrate how you can display geographical data from a data source. Here, the data source is a set of three dummy arrays where the first value is an ID of some sort, and the second and third values are latitude and longitude. In a realistic scenario your data source would likely be a text file or a SQL table. Notice that, for clarity, I don't perform any error-checking such as verifying that latitude values are between -90.0 and +90.0 and so on.
To finish up the demo program shown running in Figure 1, double-click on the Button control labeled Clear Map and edit the event handler code to produce the following:
private void button3_Click(object sender, RoutedEventArgs e)
{
  listBox1.Items.Add("Clear Map button clicked");
  int ct = myMap.Children.Count;
  myMap.Children.Clear();
  listBox1.Items.Clear();
  listBox1.Items.Add("Clearing " + ct + " items from map");
  listBox1.Items.Add("");
}
This code should be pretty clear to you. The Children.Clear method will zap away all the UI elements that you've added to your map. The Children collection can also be accessed by index if you want to clear only some UI elements.
Working with Large Data Sets
The two main alternatives to Bing Maps with WPF are Bing Maps AJAX in a Web application and Bing Maps Silverlight. I've used -- and like -- all three approaches, but I really like Bing Maps with WPF. It gives you the combined power of Bing Maps and the WPF programming model, with the convenience of the C# language.
I've found Bing Maps with WPF especially useful when I have to deal with very large data sets. In those scenarios, Bing Maps with WPF was much faster than Web-based alternatives, and it allowed me to effectively handle SQL databases with millions of records, and to display thousands of data points in real time. Bing Maps with
WPF is likely to be less manageable than a Web-based approach if you want your visualization program to be accessible to users throughout your enterprise. All in all, Bing Maps with WPF is a powerful new tool for visualizing geographical data.