In-Depth
Big Data in the Cloud
Microsoft has cooked up a feast of value-added big data cloud apps featuring Apache Hadoop, MapReduce, Hive and Pig, as well as free apps and utilities for numerical analysis, publishing data sets, data encryption, uploading files to SQL Azure and blobs.
Competition is heating up for Platform as a Service (PaaS) providers such as Microsoft Windows Azure, Google App Engine, VMware Cloud Foundry and Salesforce.com Heroku, but cutting compute and storage charges no longer increases PaaS market share. So traditional Infrastructure as a Service (IaaS) vendors, led by Amazon Web Services (AWS) LLC, are encroaching on PaaS providers by adding new features to abstract cloud computing functions that formerly required provisioning by users. For example, AWS introduced Elastic MapReduce (EMR) with Apache Hive for big data analytics in April 2009. In October 2009, Amazon added a Relational Database Services (RDS) beta to its bag of cloud tricks to compete with SQL Azure.
Microsoft finally countered with a multipronged Apache Hadoop on Windows Azure preview in December 2011, aided by Hadoop consultants from Hortonworks Inc., a Yahoo! Inc. spin-off. Microsoft also intends to enter the highly competitive IaaS market; a breakout session at the Microsoft Worldwide Partner Conference 2012 will unveil Windows Azure IaaS for hybrid and public clouds. In late 2011, Microsoft began leveraging its technical depth in business intelligence (BI) and data management with free previews of a wide variety of value-added Software as a Service (SaaS) add-ins for Windows Azure and SQL Azure (see Table 1).
| Codename |
Description |
Link to Tutorial |
| Social Analytics |
Summarizes big data from millions of tweets and other unstructured social data provided by the "Social Analytics" team |
bit.ly/Kluwd1 |
| Data Transfer |
Moves comma-separated value (CSV) and other structured data to SQL Azure or Windows Azure blobs |
bit.ly/IC1DJp |
| Data Hub |
Enables data mavens to establish private data markets that run in Windows Azure |
bit.ly/IjRCE0 |
| Cloud Numerics |
Supports developers who use Visual Studio to analyze distributed arrays of numeric data with Windows High-Performance Clusters (HPCs) in the cloud or on-premises |
bit.ly/IccY3o |
| Data Explorer |
Provides a UI to quickly mash up big data from various sources and publish the mashup to |
bit.ly/IMaOIN |
| Trust Services |
Enables programmatically encrypting Windows Azure and SQL Azure data |
bit.ly/IxJfqL |
| SQL Azure Security Services |
Enables assessing the security state of one or all of the databases on a SQL Azure server. |
bit.ly/IxJ0M8 |
| Austin |
Helps developers process StreamInsight data in Windows Azure |
bit.ly/LTL5QP |
Table 1
The SQL Azure Labs team and the StreamInsight unit have published no-charge previews of several experimental SaaS apps and utilities for Windows Azure and SQL Azure. The Labs team characterizes these offerings as "concept ideas and prototypes," and states that they are "experiments with no current plans to be included in a product and are not production quality."
|
In this article, I'll describe how the Microsoft Hadoop on Windows Azure project eases big data analytics for data-oriented developers and provide brief summaries of free SaaS previews that aid developers in deploying their apps to public and private clouds. (Only a couple require a fee for the Windows Azure resources they consume.) I'll also include instructions for obtaining invitations for the previews, as well as links to tutorials and source code for some of them. These SaaS previews demonstrate to independent software vendors (ISVs) the ease of migrating conventional, earth-bound apps to SaaS in the Windows Azure cloud.
Analyze Big Data with Apache Hadoop on Windows Azure
Apache Hadoop, MapReduce, Hive and the Pig Latin language have a near-monopoly on the mindshare of NoSQL proponents, as well as big data curators and analysts. The SQL Server team announced Project Isotope -- which includes an Apache Hadoop on Windows Azure service, more commonly called HadoopOnAzure, and a distribution for on-premises Windows Server 2008 R2 -- at the Professional Association for SQL Server Summit in October 2011.
At press time, HadoopOnAzure was a community technology preview (CTP) version released to a limited number of testers starting in December 2011; general availability is expected in mid-2012. To obtain an invitation to the CTP, fill out the Microsoft Connect survey (this requires a Windows Live ID, as do several other survey and registration pages discussed here). A preview of the on-premises version is expected in mid-2012.
The CTP includes an EMR Portal, which creates temporary, on-demand clusters in Windows Azure provisioned at the Microsoft North Central U.S. (Chicago) datacenter. When you open the HadoopOnAzure site's landing page at hadooponazure.com, click "Sign in" and provide the Windows Live ID you used to request the invitation. Request a cluster by completing the provided form.
Clicking the "Request cluster" button starts the provisioning of a no-charge Hadoop Distributed File System (HDFS) cluster, which takes a few minutes and lasts for 24 hours. If you don't renew the cluster during its last six hours of life, the system will reclaim the resources for other users.
When the process completes, the page provides tiles for numerous tasks:
- Creating a new MapReduce job
- Writing interactive JavaScript or Hive queries in the Interactive Console
- Setting up a Remote Desktop session with the cluster on Windows Azure
- Opening a TCP port for uploading data with FTPS, the Hive ODBC for Microsoft Excel, or both
- Managing the cluster by setting up data import from the Windows Azure Marketplace DataMarket; a Windows Azure Storage Vault, or ASV (Windows Azure blob storage account); or an Amazon S3 account
Hive Talkin'
Data-oriented .NET developers will probably be more comfortable with using the Hive query language, HiveQL (the syntax of which closely resembles ANSI SQL-92), than writing MapReduce jobs in Java or the EMR interactive JavaScript Console.
HiveQL generates a set of MapReduce jobs to make using filters, joins and aggregates easier, but is usually slower in execution than a relational database that can handle data of similar size. You can download an Apache Sqoop-based Microsoft SQL Server Connector here.
Sqoop is an open source tool designed for efficiently transferring bulk data between Hadoop and structured data stores such as relational databases. The Hadoop Connector uses MapReduce programs to provide bidirectional data transfer between HDFS or Hive tables and SQL Server 2008 R2 or later.
The connector adds support for SQL Server nchar and nvarchar data types to Hive. But enabling Sqoop requires downloading and installing the Cloudera Hadoop distribution and Sqoop implementation, as well as the Microsoft Java Database Connectivity (JDBC) driver. Therefore, most developers will use the built-in Windows Azure ASV or Amazon S3 blob connectors whenever possible. An important advantage of externally persisted data is that you don't lose it when your free Hadoop cluster times out. An illustrated tutorial describes how to work with ASV files in the Hadoop Command Shell via Remote Desktop Protocol, the Interactive JavaScript Console and the Interactive Hive Console.
Creating a Hive table from an external data source from a tab-delimited text blob requires executing a CREATE EXTERNAL TABLE instruction in the Interactive Hive Console to define the table's schema. Executing this HiveQL statement creates a table of U.S. certificated air carrier flight departure and arrival delays from tab-delimited text files contained in a folder of a Windows Azure blob:
CREATE EXTERNAL TABLE flightdata_asv (
year INT,
month INT,
day INT,
carrier STRING,
origin STRING,
dest STRING,
depdelay INT,
arrdelay INT
)
COMMENT 'FAA on-time data'
ROW FORMAT DELIMITED FIELDS TERMINATED by '9'
STORED AS TEXTFILE
LOCATION 'asv://aircarrier/flightdata';
HiveQL doesn't have a native date data format, so dates are specified by year, month and day values, which the original data from the U.S. Federal Aviation Administration (FAA) includes. The FIELDS TERMINATED by '9' argument specifies a tab (ANSI character 9) delimiter; substitute "," for CSV files.
Type or paste statements in a text box below the read-only display pane and click the Evaluate button to execute them (see Figure 1). The statement inserts rows from every file in the LOCATION 'asv://containername/foldername' argument; asv represents the Windows Azure storage account you specified when setting up Hive data input. Data import from an ASV data source in the same datacenter as your Hadoop clusters (North Central U.S.) is quick; the tutorial described earlier reported that importing about 3 million rows took only about 74 seconds.
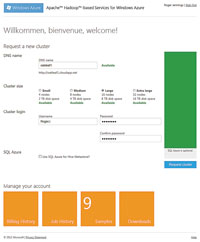
[Click on image for larger view.] |
| Figure 1. Complete the request for a new cluster of a size suitable for your source data in this Metro-centric Elastic MapReduce UI. The DNS name must be globally unique within the Widows Azure compute infrastructure. The number of sample Hadoop applications increased from four to nine in March 2012. |
The Hive ODBC driver and Excel Hive add-in combine to enable management types -- who probably are more familiar with worksheets than writing SQL queries -- to visualize data from HiveQL SELECT query result sets. As noted earlier, users must download and install the Hive ODBC driver and Excel add-in of the correct bit-ness on their local computers.
The add-in inserts a Hive Data group with a Hive Pane icon in the Excel Data tab. Clicking the icon opens a task pane UI with controls to select a Hive Connection, Hive Objects (tables or views), Columns, Filter Criteria, Aggregate Grouping, Ordering or Row Limiting. Alternatively, you can type your own HiveQL statement. Clicking "Execute Query" executes the composed or custom query and returns the result set to the worksheet, as shown in Figure 2.
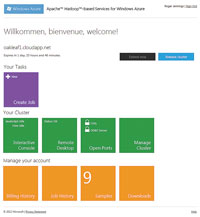
[Click on image for larger view.] |
| Figure 2. The main Elastic MapReduce page provides tiles for performing MapReduce tasks, as well as managing the cluster and your account. The Billing History page is empty because resources for testing HadoopOnAzure are free. Clicking Downloads opens a page from which you can obtain 32- or 64-bit versions of the developer preview for the Hive ODBC driver and its Excel add-in, as well as a PDF or Microsoft Word version of a How-To and FAQ for the driver. |
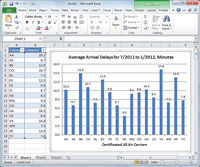
Visualizing the flight delay data in an Excel bar graph with carrier codes on the ordinate (x-axis) and average departure delay hours on the abscissa (y-axis) only requires selecting the appropriate data range and choosing Insert, Charts and Column, and formatting the chart and axis titles (see Figure 3). A tutorial describes in detail how to deploy and use the Hive ODBC driver and Excel add-in. You can download the source data files from my public Windows Live SkyDrive folder, sdrv.ms/J2FULk.
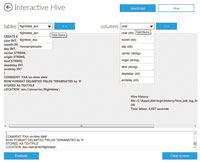
[Click on image for larger view.] |
| Figure 3. The Elastic MapReduce Interactive Hive page, shown here in a multiple exposure, persists Windows Azure Storage Vault connection metadata and lets you choose the data source you want in the Tables list. Selecting a table connection displays its fields in a Columns list. Clicking either ">>" button inserts the selection in the writable text box below the display pane. |
Cloud Numerics
Codename Cloud Numerics uses the FAA's on-time flight performance data (in its original format) that the team uploaded to publicly accessible Windows Azure blobs to compute average flight delays for all domestic U.S. flights during the 32 months ending January 2012.
Cloud Numerics, which the team introduced in January 2012, consists of a C# Cloud Numerics Application project template (see Table 2); sophisticated .NET libraries of more than 200 math, array and algorithm classes; a Microsoft.Numerics runtime; and source code to customize the template for a variety of analytic operations on distributed arrays. You can sign up for the Cloud Numerics Lab at Microsoft Connect.
| Project Name |
Description |
| AppConfigure |
Defines a UI for configuring and deploying High-Performance Clusters (HPCs) and the HPC scheduler to Windows Azure, and classes for creating the ServiceConfiguration.Cloud.csfg file, handling the Management Certificate and deploying the application to Windows Azure |
| AzureSampleService |
Generates the service hosted by Windows Azure and its ComputeNode, FrontEnd and HeadNode instances |
| FrontEnd |
Provides the Web role for accessing the Windows Azure HPC Scheduler Web Portal |
| HeadNode |
Provides the worker role entry point for interaction with the HPC cluster |
| ComputeNode |
Defines worker roles for accessing Windows Azure storage, data processing and diagnostics |
| MSCloudNumericsApp |
Includes custom code in its Program.cs class for initializing the Microsoft.Numerics runtime, reading data in parallel from Windows Azure storage into local dense arrays, converting the local to distributed arrays, processing the arrays, and writing the results to Windows Azure storage in a replaceable Main() function for testing the Cloud Numerics installation in the local Windows Azure Development Fabric |
Table 2
The names and descriptions of the six pre-built projects that comprise a Microsoft Cloud Numerics application. Increasing the number of Windows Azure Compute instances for ComputeNodes increases performance by parallel processing that's controlled by the Windows Azure HPC Scheduler.
|
The team designed Cloud Numerics as alternative for programmers and data analysts who are more comfortable with numeric analysis and C# code than Hadoop and MapReduce. An April 2012 Cloud Numerics team blog post describes the three main classes in the Microsoft.Numerics.LinearAlgebra namespace in detail. If you're not familiar with matrix multiplication and factorization, and eigenvalues and Cholesky decompositions, you might be better off sticking with Hadoop and Hive.
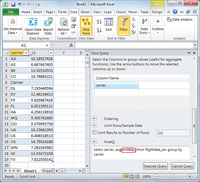
[Click on image for larger view.] |
| Figure 4. This composed HiveQL query returns the average flight arrival delay for the 16 certificated U.S. air carriers during July 2011 through January 2012, in preparation for visualization with a column graph from about 3.5 million data rows. A bug in the Hive Query task pane requires you to type the column name (arrdelay, circled in red) between the parenthesis of selected aggregate functions (avg() for this example). |
Codename Cloud Numerics takes a different approach than HadoopOnAzure for creating big data clusters hosted by Windows Azure in Microsoft datacenters. Cloud Numerics enables .NET developers to create and test local HPC clusters in the development fabric, then deploy the clusters to Windows Azure, populate them with data stored in Windows Azure blobs, and use the Windows Azure HPC scheduler to manage parallel processing.
The team recommends specifying four Extra-Large Windows Azure compute instances, each of which have eight processors, for the Compute_Nodes to process all 32 months of flight data (about 8GB) in parallel, plus two small instances each for the HeadNode and FrontEndNode. Doing this requires special dispensation from the Windows Azure billing bureaucracy, because subscriptions are limited to a maximum of 20 CPU cores by default. The team doesn't cover your Windows Azure resource cost, so testing the app in full-parallel mode costs more than $5 per hour unless you're using a free trial account. (The team doesn't consider local processing to be practical for this example, because of the large data download and amount of memory required.)
[Click on image for larger view.] |
| Figure 5. Visualizing a HiveQL aggregate query result set in Excel 2010 is simply a matter of selecting the data range and chart type, and then adding chart and axis titles. Southwest Airlines (WN) is consistently among the top on-time carriers. B6 is the FAA's unique carrier code for Jet Blue, which flies longer-than-average routes, and F9 signifies Frontier Airlines, a regional carrier. |
The sample project computes the mean delay and its standard deviation in minutes, calculates the percentage of samples above and below 0 through 5 standard deviations, and writes the data in .csv format to a blob container named flightdataresult (see Table 3).
| Mean (minutes) |
4.508555 |
|
|
| Standard deviation (minutes) |
34.96829 |
|
|
| Samples below and above k standard deviations (percent) |
0 |
69.4084 |
30.5916 |
| Samples below and above k standard deviations (percent) |
1 |
1.692023 |
8.458818 |
| Samples below and above k standard deviations (percent) |
2 |
0.007644 |
3.970135 |
| Samples below and above k standard deviations (percent) |
3 |
3.02E-05 |
2.071765 |
| Samples below and above k standard deviations (percent) |
4 |
1.21E-05 |
1.123447 |
| Samples below and above k standard deviations (percent) |
5 |
6.04E-06 |
0.631487 |
Table 3
Mean and standard deviation of certificated U.S. air carrier arrival times for 32 months of domestic U.S. flights ending January 2012. Samples above k standard deviations for k = 0 to 5 enable calculating the probability of being delayed 35 minutes or more after having been delayed k*35 minutes.
|
According to Roope Astala, a program manager on the Cloud Numerics team, the k = 0 result indicates that 70 percent of the flight arrival delays are briefer than the mean of about 4.5 minutes, so there's about a 70 percent chance that your next flight will arrive no later than 4.5 minutes after its scheduled arrival time. However, conditional probability indicates that if your flight is currently delayed 35 minutes (one standard deviation), there's a 50 percent chance it will be delayed another 35 minutes or more.
Social Analytics
Codename Social Analytics attempts to determine consumer engagement with and sentiment about two preselected subjects -- Bill Gates and Windows 8 -- by counting and analyzing the tone of millions of Twitter tweets, retweets and replies, together with optional Facebook likes, Stack Overflow questions and answers, and selected blog posts and comments.
The Social Analytics Lab has two components: A graphical engagement UI and a Social Analytics API, which is based on the Open Data Protocol (OData) and connects to the Bill Gates or Windows 8 data streams accessed from the Windows Azure Marketplace DataMarket. The team promises a future Social Analytics version will let users specify their own topics for analysis. You can get more information about the Social Analytics API and sign up for access to either or both components here.
Engagement and sentiment trends in Web content items over time are usually more important for market and brand analysis than absolute numbers for engagement or positive-to-negative sentiment ratios of engagement messages. Visualizing time-series data requires executing a Representational State Transfer (REST)-based OData URL query against the VancouverWindows8 or VancouverBillGates data sets. (Project "Vancouver" was an earlier code name for the Lab.)
The VancouverWindows8 service reference provides a Vancouver_SliceContext object having a property for each data set table.
VancouverSliceContext.ContextItems provides a reference to the ContextItems table, which contains a ContextItem member for each data item in the stream. The ISystem.Linq.IQueryable<out T> class provides the functionality to evaluate LINQ queries, such as content_Query in this example from the SocialAnalytics_WinForms sample project's C# code:
// Specify the LINQ filter, order and projection
var contentQuery =
    (from c in contentItems
     /* Join syntax below isn't supported
     join t in typeItems
     on c.ContentItemTypeId equals t.Id
     */
     where c.CalculatedToneId != null &&
      c.PublishedOn >= DateTime.Today.AddDays(-91) &&
      c.PublishedOn <= DateTime.Today.AddDays(-1)
     orderby c.PublishedOn descending
     select new
     {
         c.Id,
         c.ContentItemTypeId,
         // ContentItemType is an Enum (implemented by
         // Entity Framework June 2011 CTP and later)
         c.ContentItemType.Name,
         c.Title,
         c.PublishedOn,
         c.CalculatedToneId,
         c.ToneReliability,
         c.Summary,
         c.HtmlUrl
     }
    ).Skip(j * 500).Take(rowsRequested);
The preceding query returns the values of ContentItemType, ContentItemType.Name, CalculatedToneId and ToneReliability fields, which are of most importance to sentiment analysis (as well as other fields of general interest in 500- or 1,000-row increments). The date range for the current Vancouver data set is limited to 90 full days (about 1.4 million ContentItems) to prevent server-side timeouts with descending sorts. Specifying a fixed date range enables consistent measurement of total recent engagement, often called "buzz."
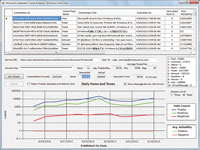
The SocialAnalyticsWinForms project provides a DataGridView control with a row for each ContentItem returned by the query; a graphical representation of total counts of ContentItems or, optionally, tweets, retweets and replies only; counts of items with positive and negative tones; and tone reliability (see Figure 6).
[Click on image for larger view.] |
| Figure 6. The SocialAnalyticsWinForms project's main form displays the query result set in a grid and a logarithmically scaled chart of counts of content items (engagement), items with positive and negative tone (sentiment), and tone reliability for up to the last 90 full days of data. A list box reports the number of items of each of the 10 Social Analytics data source types. Twitter tweets and retweets are the dominant ContentItemTypes. |
Distribution and Manipulation of Cloud Data
The Codename Data Hub Lab preview lets data owners and curators within an enterprise make their data sets available in a uniform OData format to designated knowledge workers or business groups. Data Hub is a private version of the public Windows Azure Marketplace DataMarket that's also hosted in Microsoft datacenters, but it additionally enables administrators to federate subscriptions for public data sets.
The Data Hub Lab uses Codename Data Transfer behind the scenes to upload .csv files to Windows Azure blobs, which Data Hub moves to SQL Azure tables. You can apply by signing in and answering a few questions to obtain an invitation to the Data Hub Lab preview. The current version has unofficial limits on data set size, so it's a good idea to sign into the Data Transfer Lab preview as a backstop if you intend to offer datasets with half a million or more rows. You'll find a fully illustrated tutorial for Data Hub and Data Transfer here.
Codename "Data Explorer" is designed to enable non-programming knowledge workers -- called "civilian developers" by some -- to discover data sources relevant to a data-analysis task, "enrich" the data by associating it with related data from other sources in a mashup, and publish it for colleagues to use with Excel or other BI tools. Sign up for access to the Data Explorer Lab or download a desktop client version.
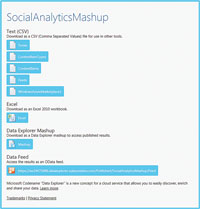
After receiving your invitation, you can follow a 41-step, illustrated Data Explorer tutorial to create a sample mashup. The tutorial uses Windows 8 data from the Social Analytics Lab and emulates the analysis capabilities of the SocialAnalyticsWinForms C# project without a single line of programming code. You can open a public copy of the mashup created by the tutorial here (see Figure 7). You'll need a Data Analytics subscription to Windows 8 data and the Account Key to view most data in the published mashup.
Codename Trust Services is a utility for encrypting sensitive data in cloud-based services -- such as Windows Azure storage or SQL Azure database tables -- while remaining in total control of the encryption keys. Having the data owner in control of the decryption key and who may access it reduces concerns with violation of data privacy policies by snooping cloud datacenter personnel.
[Click on image for larger view.] |
| Figure 7. A published Codename Data Explorer mashup that's available to the public. If you have a Codename Social Analytics data subscription and Account Key, you can download .csv files of ContentItems and related collections, create an Excel workbook with a ContentItems worksheet, and view the raw XML of the entire data feed in OData format. |
The actors in the Trust Services scenario are the Publisher, Administrator and Subscriber, who are authorized to access the data stored in the cloud. The Administrator has control of the Trust Services, which have a portal to enable creating a Trust Server Scoping. The three parties are represented by X.509 certificates, which the Administrator uploads to the Trust Server, which enables the actors to perform their roles.
The Administrator uses the Trust Services SDK to define a policy, and uses it to ensure that only the Publisher and Subscriber can access sensitive data, such as Social Security numbers. You can register for the Trust Services preview at Microsoft Connect.
The Codename SQL Azure Security Services preview enables developers to assess the security of one or all databases of a SQL Azure server instance. You don't need an invitation to start using this Lab; just go here and enter the SQL Azure server name and the account user name and password to scan the database for security vulnerabilities and generate a report.
Codename Austin brings the SQL Server team's StreamInsight complex event processing, or CEP, capabilities to the Windows Azure cloud. Using the cloud makes it practical to collect data from multiple locations, such as aircraft, automobiles or ships, as well as from clickstream or similar data (which originates on the Internet).
The Austin Lab provides the same features that Stream_Insight delivers on-premises. You can learn more about StreamInsight at the team's MSDN Portal and sign up for the StreamInsight Advisory Group. Then go to the Advisory Group's ownloads page to obtain technical details for the Austin February 2012 CTP, and sign up with your Windows Azure subscription ID for access to the Austin Windows Azure service.
If you're considering developing greenfield applications for -- or migrating your brownfield apps to -- the Windows Azure cloud, be sure to check out the Microsoft value-added applications and utilities that pertain to your projects. You'll probably find examples that save you many hours of research or coding for proof-of-concept or production projects. And keep your eyes open for new and upgraded Windows Azure SaaS offerings. Most of them are certain to gain new features by mid-2012.