In-Depth
Unleash the Power of Chrome Developer Tools: A Tutorial
Building and debugging Web-based applications with Chrome Developer Tools is easier than you might think.
I spend a lot of my time in back-end C# code, so my JavaScript skills are a little rusty. Debugging client-side JavaScript and all of the back-and-forth Representational State Transfer (REST) calls isn't as easy for me as debugging C# in Visual Studio.
That is, until I started using the Chrome Developer Tools. Google Inc. has put a lot of nice features into an integrated package that makes debugging your Web-based applications a breeze.
Why the departure from C# coverage? Don't worry, I'm not switching to Visual Basic .NET or F#. I've just spent a lot of time, recently, developing a Web application. The back-end is all C# using ASP.NET MVC 4 (Model-View-Controller, or MVC, controllers; RESTful API; service layer), but the UI is all client-side JavaScript, CSS and HTML5. The project uses Backbone and SignalR to provide a single-page Web interface.
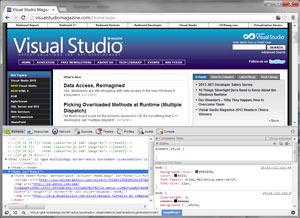
To get started with the Chrome Developer Tools, I went to VisualStudioMagazine.com and then pressed CTRL+SHIFT+I (or you could simply use F12). This turns on the Chrome Developer Tools, as shown in Figure 1 [This article was written using screenshots from the previous design of the Visual Studio Magazine Web site. -- Ed.].
 [Click on image for larger view.]
Figure 1. Chrome with the Developer Tools enabled.
[Click on image for larger view.]
Figure 1. Chrome with the Developer Tools enabled.
The Developer Tools window contains different panels such as Elements, Network and Sources, which appear as tabs across the top. In this article, I'll review a few of the key panels and provide tips on how to maximize each one.
Elements Panel
This panel is like a super-charged Document Object Model (DOM) viewer. Sure, I can do a View Source on any Web page, but that only gives me the source exactly as it's served up by the Web server. The Elements panel provides me with a color-coded, parent/child tree-based display of the page.
If I move the mouse over the HTML displayed in the Elements panel, the Web view highlights the entire element I'm hovering over. This makes it easy for me to identify the visual representation of that HTML.
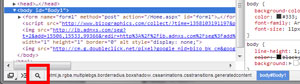
If the HTML is rather large, hovering over different elements and drilling down into the children (and their children and their children) to find out which one is displaying the element I'm curious about can be tedious. Instead, I can click the little magnifying class at the bottom of the Elements panel, as shown in Figure 2.
 [Click on image for larger view.]
Figure 2. The magnifying glass enables point-and-click selection.
[Click on image for larger view.]
Figure 2. The magnifying glass enables point-and-click selection.
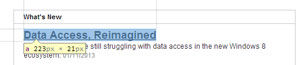
Now, the operation is flipped. I hover over the actual display of the Web page and the complete element is highlighted along with useful information such as the tag name and size, as shown in Figure 3.
 [Click on image for larger view.]
Figure 3. Detailed Element information.
[Click on image for larger view.]
Figure 3. Detailed Element information.
I can click on any item and the DOM view jumps directly to that element. This feature makes locating something within a large HTML page virtually effortless.
Once the element is selected, I have full control to edit not only the DOM itself (and see my edits reflected in the rendered page immediately), but the complete CSS styling as well.
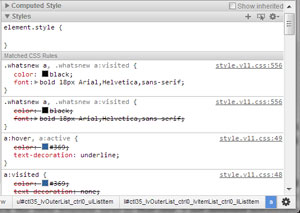
In the previous example, I clicked on the title for a Visual Studio Magazine article. As you can see by the tooltip that popped up in Figure 3, it's an anchor (a) tag that rendered to a size of 223 x 21 pixels. The style information displayed in the right-hand side of the Elements panel shows every matching CSS style for the anchor. Styles that are not used because a more-specific match was found are crossed out, as shown in Figure 4.
 [Click on image for larger view.]
Figure 4. Matching CSS style information for an element.
[Click on image for larger view.]
Figure 4. Matching CSS style information for an element.
If I want to know how a different color for the article title might look, I can click on the color square that displays the element's color and pick a new color. Whatever color I pick is immediately reflected in the rendered Web page.
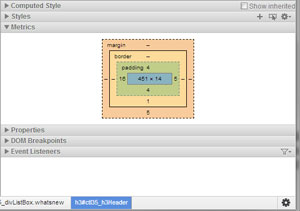
What if I'm working on some layout issues instead of colors? If I click the little triangle next to the Styles heading to collapse the Styles section (or simply scroll down), I can see there's a Metrics heading. If I click the little triangle next to that one, I get detailed information on the dimensions of the element, its padding, border and margins (see Figure 5).
 [Click on image for larger view.]
Figure 5. Sizing information for padding, border and margins.
[Click on image for larger view.]
Figure 5. Sizing information for padding, border and margins.
What's more, I can double-click any of the numbers in the Metrics section and edit them directly to see how different values affect my layout. What if the top padding of 4 isn't big enough? I just double-click on the 4, change it to 12 and press enter. The change is immediately reflected in the Web view of the page. The Elements panel is invaluable for getting your CSS and layout picture-perfect.
Network Panel
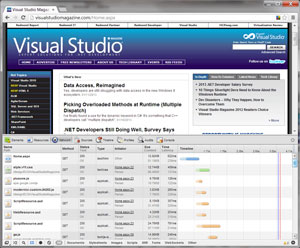
Figure 6 shows the Network panel. This panel provides a Timeline of all of the resources that were downloaded during the loading of the current page (if you don't see anything, press F5 to refresh the page).
 [Click on image for larger view.]
Figure 6. The Network panel shows a Timeline of resources.
[Click on image for larger view.]
Figure 6. The Network panel shows a Timeline of resources.
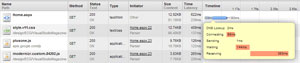
In the Timeline, the display of each network request contains a shaded section and a darker section. The shaded section is the time between when the request was made and when the response from the server started. The darker section is the total time for the response. I can hover over any of the sections to get detailed information about the request (see Figure 7).
 [Click on image for larger view.]
Figure 7. Detailed information on a network request.
[Click on image for larger view.]
Figure 7. Detailed information on a network request.
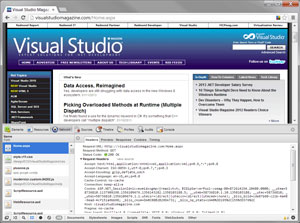
Clicking on the name of the request (the first column) gives you access to every part of the request. Figure 8 shows information about the initial request on Home.aspx.
 [Click on image for larger view.]
Figure 8. Network request details.
[Click on image for larger view.]
Figure 8. Network request details.
From this UI, I can see the individual request and response headers, the response text that was returned from the network request, and any cookies sent in the request or found in the response. Plus, the timing information is available here as well. Clicking the "x" to the left of the Headers tab closes this inspector.
A couple of handy shortcuts are available in the Network panel. Right-click on any row in the Network panel and the context menu includes a number of handy items. Clear Browser Cache and Clear Browser Cookies are helpful shortcuts to use when you want to make sure you're not getting cached data, or you want any existing cookies for the Web page deleted.
You can also sort on any of the columns in the Network panel. Sorting by Size will quickly allow you to see which requests represent the most data. Or click on the Time column to see which network call takes the longest. This type of data can be used to optimize your page-load times as well as the amount of network traffic.
Sources Panel
The Sources panel usually comes into play when you've opened a source file by clicking on something in the Elements panel such as a link to a JavaScript file. However, you can view any file you'd like to see by simply pressing CTRL+O. This pops open a window in which you can type a filter to find the file that you're looking for.
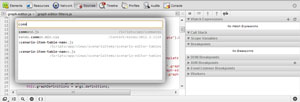
Suppose I'm investigating a problem that's reported on line 23 of a script file called command.js. While in the Sources panel, I can press CTRL+O and start typing "command" (see Figure 9).
 [Click on image for larger view.]
Figure 9. Finding a source file by name.
[Click on image for larger view.]
Figure 9. Finding a source file by name.
By the time I've typed "comm" the list has already been filtered down. I select the one I'm looking for, press Enter, and the file is loaded and displayed. But my problem is on line 23. I can scroll down to line 23, or I can use the CTRL+G shortcut to jump to line 23. I can also make the search and navigation to line 23 instantaneous by entering "comm:23." Now when I select the file to open it, it jumps directly to line 23.
C# developers love breakpoints. They're a handy way to stop execution of code at an exact moment in time. While I have a file opened in the Source panel, I can set a breakpoint by either clicking on the line number in the left-hand margin, or pressing CTRL+B to toggle the current line as a breakpoint. Once a breakpoint is set, I reload the page, and the breakpoint will stop execution when hit.
When stopped, Chrome acts like just about any IDE debugger you're used to: You can view local and global variables, add new watch expressions and view the call stack. If you're not a JavaScript ninja, the Source panel can help you navigate your way around JavaScript code.
Console Panel
The Console panel is its own panel, but a Console panel is also available in any of the other panels by simply pressing Escape. This toggles the visibility of the Console panel.
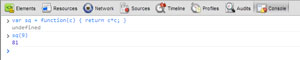
The Console panel is similar to the Immediate window in Visual Studio. It can be used to instantly evaluate expressions and JavaScript code. Figure 10 shows an example of creating a function and immediately executing it.
 [Click on image for larger view.]
Figure 10. Instant JavaScript emulation in the Console panel.
[Click on image for larger view.]
Figure 10. Instant JavaScript emulation in the Console panel.
The Console panel supports auto-completion, and it's context-aware. As you enter expressions, it will include local and global variables when showing you a list of available choices in the auto-completion process.
You can also log debug messages to the Console. This is much easier than using the traditional JavaScript alert function because it doesn't block the UI from processing. Anywhere I want to put some debug information, I can call the log method of the console object:
if( item.length == 0) {
  console.log('item had zero length');
  return;
}
Of course, not all browsers support the console object, so it's always best to make sure it exists before using it:
if( item.length == 0) {
  if( window.console && console.log )console.log('item had zero length');
  return;
}
Configurable Settings
Like any good tool, the Developer Tools in Chrome have a number of configurable settings that allow you to control how you use them. When the Developer Tools window is displayed, click the gear icon in the lower-right corner of the window.
On the General tab, there's a "Dock to right" option. This option allows you to dock the Developer Tools window in a vertical manner to the right of the Web view. This gives you maximum height for rendering your Web page. A lot of people like the side-by-side view of the Dock to right option. Of course, the Developer Tools window can be totally undocked into its own separate window by clicking on the icon in the lower left-hand corner of the Developer Tools window. This works great on multi-monitor setups.
The Overrides tab allows you to control how the browser acts when talking to a Web server. You can change the User Agent string by clicking the User Agent checkbox, and then selecting one of the predefined User Agent strings, or entering in your own.
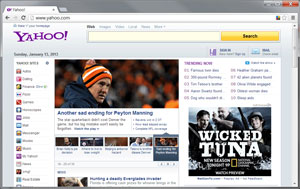
Figure 11 shows an example of the Yahoo! main page in a regular Chrome window.
 [Click on image for larger view.]
Figure 11. The Yahoo! homepage in a regular browser.
[Click on image for larger view.]
Figure 11. The Yahoo! homepage in a regular browser.
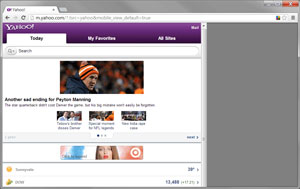
If you go into the Developer Tools and change the User Agent to "Android 4.0.2 - Galaxy Nexus" (a tablet) and refresh the screen, the Web site now thinks it's a mobile browser and renders the page as shown in Figure 12.
 [Click on image for larger view.]
Figure 12. The Yahoo! homepage rendered for a tablet-based browser.
[Click on image for larger view.]
Figure 12. The Yahoo! homepage rendered for a tablet-based browser.
You can also override the device metrics that you're emulating (the metrics are automatically set when overriding the User Agent with any mobile- or tablet-based device, so be aware of this).
Remote Debugging on an Android Device
While changing the User Agent and metrics of the browser may work in a lot of situations, there are times when you really need to work directly on the device. If you're developing on an Android device with the mobile Chrome browser, you can actually use the Developer Tools on your PC to talk to the mobile Chrome browser for live interaction and debugging.
First, enable USB Debugging on the Android device. Then, start Chrome on the Android device, go to Settings and select Developer Tools. Next, check the option labeled Enable USB Web Debugging. Then navigate to the page that you want to debug. Everything on the device is now set.
On my desktop, I need to connect my device via a USB cable. I then go to a command prompt and use the Android Debug Bridge (ADB) from the Android SDK. I tell the ADB to forward all local calls on a particular port to the device for Chrome debugging with the following command:
adb forward tcp:9999 localabstract:chrome_devtools_remote
Now I fire up Chrome on my desktop and navigate to localhost:9999. (I picked port 9999 because ports above 8000 are usually available for this type of thing, and it's easy to remember.) At this point, Chrome displays a list titled "Inspectable pages." This list shows all pages in the remote browser that Chrome can debug. I select the page I'm interested in, and the Chrome Developer Tools loads on my desktop.
Once launched, I can do all of the things that I previously did, but this time I'm on the actual device! Everything is available remotely:
- HTML editing
- CSS editing
- JavaScript debugging with breakpoints, variable inspection and so on
The Network panel is especially useful when you're remote debugging on the device. You can get metrics on actual device speeds (3G, 4G) instead of trying to test them via an emulator that can only simulate such traffic. And remember, the Network panel gives you complete network data (request, response, cookies) so you can see the exact data as sent and received by the device itself.
The Chrome Developer Tools serve as a handy addition to any developer's toolbox. The tools give you the power to inspect and tweak your pages from right inside the browser, along with detailed information on the amount of resources your Web pages use.