In-Depth
Measuring Test Effort Progress with EVM
An important part of a software testing -- or coding -- effort is the ability to measure progress. One way for doing this is a technique called Earned Value Management (EVM). Find out how easy it is to apply EVM to your own projects.
In many software development environments, an important part of the overall software-testing effort is having the ability to measure the progress of the test effort. One technique for doing this is a project management technique called Earned Value Management (EVM).
EVM is a simple quantitative technique that can be used to measure the schedule progress -- and optionally the budget progress -- of any type of project, including a software-testing effort or some part of the overall effort. EVM had its origins in a 1962 initiative by the U.S. Department of Defense called PERT/Cost. Although EVM is simple to use and can be applied to test efforts of any size, based on my experience many software engineers incorrectly believe that EVM is suitable for use only with large software development efforts.
In this month's Test Run column I explain what EVM is, walk you through an example of using EVM to measure test-effort progress, and describe when to use EVM and when not to use it.
Preparing Earned Value Management
The best way to understand EVM is to walk through a concrete example. The first step in EVM is to break down the part of the testing effort you want to monitor into smaller tasks. In standard project management terminology these smaller tasks are usually called work packages, but in a software development environment, often they're simply called subtasks.
Let me emphasize up front that breaking down a software testing effort, or any project for that matter, typically is the most difficult part of the EVM process.
Now let's assume that you break down your test effort into five subtasks, labeled A through E, as shown in Figure 1. The level of detail, or granularity, you break your overall testing effort down to depends on many factors. As a general rule of thumb, in a software-testing environment, individual subtasks are often scoped so that each subtask requires roughly between four and 40 hours to complete.

[Click on image for larger view.] |
| Figure 1. Mapping Subtasks for EVM |
The topology of the diagram in Figure 1 indicates that testing subtask A must be completed before B starts, and that subtasks C and D must both be completed before subtask E can start.
The next step in EVM is to estimate how much of the overall test resource allotment, or budget, is associated with each subtask. This is called the planned value (PV) for each subtask.
The example in Figure 2 assumes you have a total test budget of 350 units. PV units are most often measured in dollars (or Euros or rubles and so on). The absolute magnitude of cost units is unimportant, so the 350 total planned value in our example could represent $350 or $350,000. Besides monetary units such as dollars, the units of PV can also be arbitrary units that measure the cost in some way.
[Click on image for larger view.] |
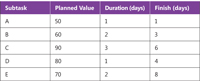
| Figure 2. Scheduling Subtasks |
There are no magic formulas to determine the subtask PV, but it's important to note that the accuracy of the schedule progress metrics produced by EVM depends entirely on the accuracy of your initial PV metrics. In Figure 2, you can see the PV estimates for subtasks A, B, C, D and E are 50, 60, 90, 80 and 70 respectively.
After estimating PV, the next step in EVM is to estimate how long each subtask will take, and then use these estimates to determine the finish time for each subtask. In Figure 2, I determined (using historical data, or previous experience, or some quantitative technique) that subtasks A, B, C, D and E are estimated to take 1, 2, 3, 1 and 2 days each. In this example, the units of time are days, but you can use hours or weeks or any measure as long as you're consistent throughout the EVM analysis.
We start at time = 0, so if subtask A is estimated to take 1 day, it will finish at day 1. Subtask B would then begin at day 1 and require 2 days, ending at day 3. Notice that subtask E cannot begin until subtasks C and D both finish, which would be on day 6 (the larger of the finish times for C and D), and so would end at day 8.
Once you've determined what your software test effort subtasks are, and estimated their PV, durations and finish times, the next step is to create a table of cumulative PVs. You begin by constructing a table like the one shown in Figure 3. The leftmost column marks the end of each unit of time (in this example, days 1 through 8). The second column is the cumulative PV at the end of each day, which can be determined from the previous table of PV data.
[Click on image for larger view.] |
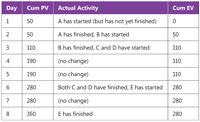
| Figure 3. Schedule Progress with Cumulative PV |
At the end of day 1, subtask A should be completed and so the cumulative PV should be 50, the PV for A. At the end of day 2, no new subtasks are expected to be finished so the cumulative PV is still 50. At the end of day 3, subtask B should now be finished and so the cumulative PV should be 50 for subtask A plus 60 for subtask B = 110. In the same way the cumulative PVs at the end of days 4 through 8 can be determined.
Measuring Test Schedule Progress
Let's suppose that your test effort unfolds as shown in the third column in the table in Figure 3. These activities represent what actually happens as opposed to what you expect to happen. The difference between what you had planned to accomplish (your PV) and what you actually accomplished is your earned value (EV).
So, at the end of day 1, subtask A started but did not finish as scheduled. Therefore the cumulative EV in column 4 is 0. At the end of day 2, subtask A does in fact finish and so I earn 50 (the PV associated with A), and place that value in column 4. At the end of day 3, subtask B finishes and so the cumulative EV is 50 + 60 = 110. But at the end of day 4, no new subtasks finish and so the cumulative EV is still 110. At the end of each day, or whatever time unit you're using, you update the cumulative EV column.
Your test effort schedule progress is easily read from the table in Figure 3. If the cumulative EV is less than the cumulative PV, then you're behind schedule. If the cumulative EV is exactly equal to the cumulative PV, then you're on schedule. And if the cumulative EV is greater than the cumulative PV, then you're ahead of schedule (which, by the way, is not necessarily always a good thing).
EVM typically uses two specific metrics to quantify how much ahead, behind or on schedule your test effort is. The so-called schedule variance (SV) at any given point in time is simply the cumulative EV minus the cumulative PV. For example, in Figure 3, at the end of day 4, SV = 110 - 190 = -80 indicating the test effort is 80 cost units (typically dollars) of PV behind schedule. A negative SV indicates a project is behind schedule and positive SV indicates a project is ahead of schedule.
Because the absolute magnitude of SV depends on the units of PV, an alternative metric called the schedule performance index (SPI) is often used instead of SV. SPI is cumulative EV divided by PV. In my example, at the end of day 4, the SPI is 110 / 190 = 0.58.
This can be interpreted to mean that I have only earned 58 percent of my PV -- in other words, I'm 42 percent behind my scheduled PV.
SPI values less than 1.00 mean the test effort is behind schedule, an SPI value of 1.00 means the test effort is exactly on schedule, and SPI values greater than 1.00 mean the test effort is ahead of schedule.
Wrapping Up
As you've seen in this column, monitoring software-test effort schedule progress with EVM is easy. However, as with any quantitative technique, your results are only as good as your initial data -- in this case the PVs associated with each test effort subtask. EVM is a dynamic activity and you should revise your estimates as your test effort unfolds.
In the introduction to this column I mentioned that EVM can be used to measure both schedule progress and budget progress. Measuring schedule progress as I've explained here is a prerequisite for measuring budget progress. Measuring budget progress requires that you actively monitor how much of your resources you spend at the end of each time unit. This is typically more difficult than measuring your work progress, so measuring budget progress with EVM is often only used on larger software projects and will be the subject of a future Test Run column.
The EVM approach for measuring test effort schedule progress I've presented here, which essentially is a paper-and-pencil technique, is well suited for small projects and projects being developed in an Agile environment. When developing large software projects, software tools are usually needed to manage the complexity introduced by the existence of hundreds or even thousands of test effort subtasks.
About the Author
Dr. James McCaffrey works for Microsoft Research in Redmond, Wash. He has worked on several Microsoft products including Azure and Bing. James can be reached at [email protected].