The Data Science Lab
Clustering Non-Numeric Data Using C#
Clustering non-numeric -- or categorial -- data is surprisingly difficult, but it's explained here by resident data scientist Dr. James McCaffrey of Microsoft Research, who provides all the code you need for a complete system using an algorithm based on a metric called category utility (CU), a measure how much information you gain by clustering.
Clustering data is the process of grouping items so that items in a group (cluster) are similar and items in different groups are dissimilar. After data has been clustered, the results can be visually analyzed by a human to see if any useful patterns emerge. For example, clustered sales data could reveal that certain types of items are often purchased together, and that information could be useful for targeted advertising. Clustered data can also be programmatically analyzed to find anomalous items.
For completely numeric data, the k-means clustering algorithm is simple and effective, especially if the k-means++ initialization technique is used. But non-numeric data (also called categorical data) is surprisingly difficult to cluster. For example, suppose you have a tiny dataset that contains just five items:
(0) blonde   norway   male
(1) redhead  england  male
(2) gray     england  male
(3) blonde   spain    female
(4) gray     england  female
Each item represents a person and has three attributes: hair color, county, and gender. Even for this tiny dataset, it's not at all obvious how to group this data into two clusters so that people in each cluster are similar. In this article I present a complete system for clustering non-numeric data. The underlying algorithm is based on a metric called category utility (CU). The CU metric is a measure how much information you gain by clustering.
 [Click on image for larger view.] Figure 1: Clustering Non-Numeric Data Using C# in Action
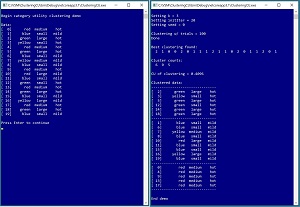
A good way to see where this article is headed and to understand category utility is to examine the screenshot of a demo program in Figure 1. The demo sets up and displays a 20-item dataset. Each data item has three attributes: color (red, blue, green, yellow), size (small, medium, large), and temperature (mild, hot). Behind the scenes, the demo converts each string data value into a 0-based index value. For example, the size values are encoded as medium = 0, small = 1, large = 2.
The demo prepares to cluster the data by setting the values of four parameters. The number of clusters is set to k = 3. The number of times to iterate during the clustering initialization process is set to initIter = 20. A seed value for a random number generator is set to seed = 0. And the number of times to try different clustering, looking for the best result, is set to trials = 100. These four parameter values will be explained in more detail shortly.
After clustering completed, the result was displayed as [2, 1, 0, 0, . . 1]. This means data item [2] is in cluster 0, item [1] is in cluster 1, item [2] is in cluster 0, and so on, to item [19] in cluster 1. The cluster counts are (6, 9, 5) which means there are 6 data items assigned to cluster 0, 9 items assigned to cluster 1, and 5 items assigned to cluster 2.
The value of the category utility of the clustering is CU = 0.4096. Values of CU will be between 0.0 and 1.0 where larger values of CU are better. The demo concludes by displaying the string data organized by clusters. Cluster 0 could be described as a "green-hot" cluster. Cluster 1 is a "mild" cluster. And cluster 2 is a "red-medium-hot" cluster. If you look at the data carefully you should get an intuitive notion that the clustering makes sense.
In order to use the code presented here with your own data you must have intermediate or better programming skill with a C-family language. In order to significantly modify the demo algorithm you must have expert level programming skill. This article doesn't assume you know anything about clustering or category utility. The demo is coded in C# but you shouldn't have too much trouble refactoring the code to another language if you wish. The source code for the demo program is too long to be presented in its entirety in this article but the complete code is available in the accompanying file download.
Understanding Category Utility
The category utility (CU) of a given clustering of a dataset is a numeric value that reflects how good the clustering is. Larger values of CU indicate a better clustering. If you have a goodness-of-clustering metric such as CU, then clustering can be accomplished in several ways.
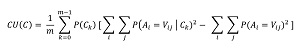
The math definition of CU is shown in Figure 2. The equation looks intimidating but is simpler than it appears. In the equation, C is a clustering, A is an attribute, such as "color", and V is a value, such as "red". Lower case k is an index variable for each cluster ID, and lower case "m" is used for the number of clusters. (The equation uses "m" rather than "K" to avoid confusion with "k".)
 [Click on image for larger view.] Figure 2: Math Equation for Category Utility
The CU equation has two double-summation terms. The right-hand summation is called the unconditional term. It represents the amount of order in the entire dataset. The left-hand summation is called the conditional term. It represents the amount of order in the clustered dataset. The difference between the two summations represents the amount of order you gain by clustering the data. The P(Ck) and 1/m terms are weights to account for different numbers of data items in each cluster, and the number of clusters used.
Calculating CU is best explained by example using a small dataset. Suppose your source data is the dataset presented above, with just five items where each item has three attributes:
[0] blonde   norway   male
[1] redhead  england  male
[2] gray     england  male
[3] blonde   spain    female
[4] gray     england  female
And suppose you cluster the data into k = 2 clusters like so:
k = 0
[0] blonde   norway   male
[3] blonde   spain    female

k = 1
[1] redhead  england  male
[2] gray     england  male
[4] gray     england  female
The CU value of this particular clustering is CU = 0.3733. First, the value of the right-hand double summation is calculated as:
blonde:   (2/5)^2 = 0.160
redhead:  (1/5)^2 = 0.040
gray:     (2/5)^2 = 0.160

norway:   (1/5)^2 = 0.040
england:  (3/5)^2 = 0.360
spain:    (1/5)^2 = 0.040

female:   (2/5)^2 = 0.160
male:     (3/5)^2 = 0.360

sum =               1.320
This sum is an indirect representation of how well you could do by guessing values without any clustering. You can think of this as the amount of order in the data. For example, for an unknown item, if you guessed the hair color attribute is "blonde," your probability of being correct is 2/5.
Next, the left-hand double summation is calculated similarly except that you compute a sum for each cluster separately. For cluster k = 0:
blonde:   (2/2)^2 = 1.000
redhead:  (0/2)^2 = 0.000
gray:     (0/2)^2 = 0.000

norway:   (1/2)^2 = 0.250
england:  (0/2)^2 = 0.000
spain:    (1/2)^2 = 0.250

male:     (1/2)^2 = 0.250
female:   (1/2)^2 = 0.250

sum =               2.000
And then for cluster k = 1:
blonde:   (0/3)^2 = 0.000
redhead:  (1/3)^2 = 0.111
gray:     (2/3)^2 = 0.444

norway:   (0/3)^2 = 0.000
england:  (3/3)^2 = 1.000
spain:    (0/3)^2 = 0.000

female:   (1/3)^2 = 0.111
male:     (2/3)^2 = 0.444

sum =               2.111
These two sums are also indirect measures of how well you could do by guessing values, or equivalently the amount of order due to the clustering. At this point you could just use the difference between the two summations as a measure of the increase in order you get by clustering. But this approach is too simple because it doesn't take into account the number of items in each cluster, or the number of clusters used.
The P(Ck) values in the equation means, "probability of cluster k." Because cluster k = 0 has 2 items and cluster k = 1 has 3 items, the two P(C) values are 2/5 = 0.40 and 3/5 = 0.60 respectively. The P(Ck) values adjust for cluster size. The 1/m term is a scaling factor that takes the number of clusters into account. For the tiny dataset m = 2 so 1/m = 1/2.
Putting the two summations and two weights together gives the value of CU for the clustering:
CU = 1/2 * (0.40 * (2.000 - 1.320) + 0.60 * (2.111 - 1.320))
   = 1/2 * (0.272 + 0.475)
   = 0.3733
Ideas similar to category utility have been around for decades. To the best of my knowledge, the definition of CU that I use was first described in a 1985 research paper by M. Gluck and J. Corter.
The Demo Program
To create the demo program, I launched Visual Studio 2019. I used the Community (free) edition but any relatively recent version of Visual Studio will work fine. From the main Visual Studio start window I selected the "Create a new project" option. Next, I selected C# from the Language dropdown control and Console from the Project Type dropdown, and then picked the "Console App (.NET Core)" item.
The code presented in this article will run as a .NET Core console application or as a .NET Framework application. Many of the newer Microsoft technologies, such as the ML.NET code library, specifically target .NET Core so it makes sense to develop most new C# machine learning code in that environment.
I entered "ClusteringCU" as the Project Name, specified C:\VSM on my local machine as the Location (you can use any convenient directory), and checked the "Place solution and project in the same directory" box.
After the template code loaded into Visual Studio, at the top of the editor window I removed all using statements to unneeded namespaces, leaving just the reference to the top-level System namespace and the Collections.Generic namespace. In a non-demo scenario you'll likely need the System.IO namespace to read data into memory from a text file. The demo needs no other assemblies and uses no external code libraries.
In the Solution Explorer window, I renamed file Program.cs to the more descriptive ClusteringCUProgram.cs and then in the editor window I renamed class Program to class ClusteringCUProgram to match the file name. The structure of the demo program, with a few minor edits to save space, is shown in Listing 1.
Listing 1. CU Clustering Demo Program Structure
using System;
using System.Collections.Generic;
// using System.IO;

namespace ClusteringCU
{
  class ClusteringCUProgram
  {
    static void Main(string[] args)
    {
      Console.WriteLine("Begin demo");

      string [][] data = new string[20][];
      data[0] = new string[]
        { "red", "medium", "hot" };
      data[1] = new string[]
        { "blue", "small", "mild" };
      . . .
      data[19] = new string[]
        { "blue", "small", "mild" };

      Console.WriteLine("Data: ");
      ShowMatrix(data,
        new int[] { 8, 8, 7 }, true);

      Console.WriteLine("Hit Enter to continue");
      Console.ReadLine();

      int k = 3;
      int initIter = 20;
      int seed = 0;
      Console.WriteLine("Setting k = " + k);
      Console.WriteLine("Setting initIter = " +
        initIter);
      Console.WriteLine("Setting seed = " +
        seed);
      CatCluster cc = new CatCluster(data,
        k, initIter, seed);

      int trials = 100;
      Console.WriteLine("Clustering trials = " +
        trials);
      cc.Cluster(trials);
      Console.WriteLine("Done");

      Console.WriteLine("Best clustering: ");
      ShowVector(cc.clustering, 3);

      Console.WriteLine("Cluster counts: ");
      ShowVector(cc.counts, 3);

      Console.WriteLine("CU of clustering = " +
        cc.catUtil.ToString("F4"));

      Console.WriteLine("Clustered data: ");
      ShowClustered(data, k, cc.clustering,
        new int[] { 8, 8, 7 }, true);

      Console.WriteLine("End demo ");
      Console.ReadLine();
    }

    static void ShowMatrix(string[][] m,
      int[] wids, bool indices) { . . }

    static void ShowClustered(string[][] data,
      int K, int[] clustering, int[] wids,
      bool indices) { . . }

    static void ShowVector(int[] vec,
      int wid) { . . }

  } // class Program

  public class CatCluster
  {
    public int K;  // number clusters
    public string[][] data;  // "red"  "blue"  . .
    public int[][] ds;  // data converted to 0, 1,
    public double catUtil;  // best CU
    public int[] clustering;  // best clustering
    public int[] counts;  // num items each cluster
    public int initIter;  // find initial clusters
    public int N;  // total number data items
    public int dim;  // num elements each item
    private Random rnd;

    public CatCluster(string[][] data, int k,
      int initIter, int seed)
    {
      this.K = k;
      this.data = data;
      this.ds = Convert(data);  // strings to ints
      this.catUtil = -1.0;  // will always update
      this.N = data.Length;
      this.dim = data[0].Length;
      this.clustering = new int[this.N];
      this.counts = new int[k];  // one per cluster
      this.initIter = initIter;
      this.rnd = new Random(seed);
    }

    // public and private methods here

  } // class CatCluster
} // ns
All of the program control logic is contained in the Main() method. All of the clustering logic is contained in a class named CatCluster. The demo begins by setting up the source data:
string [][] data = new string[20][];
data[0] = new string[] {"red", "medium", "hot"};
data[1] = new string[] {"blue", "small", "mild"};
. . .
data[19] = new string[] {"blue", "small", "mild"};
The demo data is hard-coded and stored into an array-of-arrays style matrix. In a non-demo scenario you'd likely read your data into memory from a text file, using a helper function along the lines of:
string fn = "..\\..\\..\\Data\\my_data.txt";
double[][] string = MatLoad(fn, 20,
  new int[] { 0, 1, 2 }, '\t');
This means, "read 20 lines, columns 0, 1 and 2 of the data file (skipping lines that begin with "//") from file my_data.txt where values are separated by tab characters." The demo program in the file download that accompanies this article has an implementation of the MatLoad() function.
After setting up the training data, the demo program displays the data using these statements:
Console.WriteLine("Data: ");
ShowMatrix(data, new int[] { 8, 8, 7 }, true);
Console.WriteLine("Press Enter to continue");
Console.ReadLine();
The ShowMatrix() helper function pretty-prints an array-of-arrays. The function accepts an array of widths for the values in each column (using blank space padding) and a Boolean parameter that controls whether to display row indices or not. You may want to customize ShowMatrix() for some problem scenarios.
The clustering is prepared by setting up values for the CatCluster constructor and instantiating a CatCluster object:
int k = 3;
int initIter = 20;
int seed = 0;
CatCluster cc = new CatCluster(data, k,
  initIter, seed);
After the clustering object has been created, the data is clustered with these statements:
int trials = 100;
Console.WriteLine("Trials = " + trials);
cc.Cluster(trials);
Console.WriteLine("Done");
The Cluster() method iterates 100 times. On each iteration, the result clustering is checked to see if a new best clustering (larger CU value) has been found. If so, the new best clustering, associated CU value, and cluster counts are updated and saved as class fields. The number of trials to use is problem-dependent and must be determined by trial and error.
The demo displays clustering results:
Console.WriteLine("Best clustering found: ");
ShowVector(cc.clustering, 3);

Console.WriteLine("Cluster counts: ");
ShowVector(cc.counts, 4);
Helper function ShowVector() accepts a width argument to use for each value. Because the demo data has only 20 items, it's feasible to display the entire clustering array. Examining the number of data items assigned to each cluster can reveal unusual clusters that you might want to take a closer look at. The clustering algorithm is designed to prevent any cluster count of 0, so if you see a zero count that indicates a logic error that should be investigated.
Next the demo displays the category utility value of the final clustering:
Console.WriteLine("CU of clustering = " +
  cc.catUtil.ToString("F4"));
The CU value can be used to compare the quality of different clusterings on a particular dataset, but the magnitudes of CU values depend on the source data so CU values for different datasets cannot be compared directly.
The demo concludes by displaying the source data, ordered by cluster assignment:
Console.WriteLine("Clustered data: ");
ShowClustered(data, k, cc.clustering,
  new int[] { 8, 8, 7 }, true);
The ShowClustered() helper function accepts arguments for the widths to use for each column, and a Boolean parameter controlling whether to print row indices or not.
Computing Category Utility
Conceptually, computing the category utility is relatively easy but implementing CU in code is difficult. You won't need to modify the code in method CatUtility() unless you have an unusual problem scenario. Your main customization for CatUtility() is inserting various WriteLine() statements so you can examine the behavior of the method.
The signature of the CatUtility() method is:
public static double CatUtility(int[][] ds,
  int[] clustering, int fromIdx, int toIdx,
  int K)
{
  fromIdx = 0;  // from is always 0
  int N = toIdx - fromIdx;
  int dim = ds[0].Length;
. . .
The method is implemented as static so that it can be used as a standalone function if necessary. The source data is an array-of-arrays of int type matrix rather than using the raw source string data. Using int values is much more efficient because the int values can be used as indexes into arrays, such as the clustering result and the counts of the values of each attribute.
Because the clustering algorithm builds up the clustering one data item at a time, it's necessary to compute the CU on subsets of the dataset. Therefore, the CatUtility() method accepts a fromIdx (inclusive) parameter and a toIdx (exclusive) parameter. For example, CatUtility(ds, clustering, 0, 7, K) computes the CU for dataset ds using just rows 0 to 6. The fromIdx parameter is really a dummy parameter because fromIdx is always assumed to be 0. Including the dummy fromIdx allows you to change the implementation if necessary, without changing the interface.
Most of the code in method CatUtility() counts the number of data items such as the number of items in each cluster, the number of each value for an attribute, and so on. For example, the method computes the number of items in each cluster using these statements:
int[] clusterCts = new int[K];
for (int i = 0; i < toIdx; ++i) {
  int cid = clustering[i];
  ++clusterCts[cid];
}
The key data structure that holds counts is condCts[k][att][id]. This data structure holds the number of values for each attribute in each cluster. It is an array of arrays of arrays or you can think of it as a 3-d array. For example, suppose you have k = 4 clusters and dim = 5 attributes (such as color or size). If the color attribute is encoded as 3 and the "red" value is encoded as 0 then condCts[2][3][0] holds the number of data items in cluster 2 that have color column value of "red".
Converting String Data to Int Data
Because the CatUtility() method works with int values, the source string data must be converted to int data. The CatCluster class does this using a helper function Convert(). One of the things that has to be dealt with is that a particular string value could occur in different columns of the source data. For example, some dataset could have a size column with values "small", "medium", and "large". And the same dataset could have height column with values "short", "medium", and "tall". The "medium" size is not the same as the "medium" height.
Method Convert() uses an array of Dictionary<string, int> collections, one for each attribute column of the dataset. A string value such as "red" is the Dictionary key and the Dictionary int value represents the ID. The CatCluster class creates the array of Dictionary objects using a helper function MakeColStrToIntConverter() where the name means, "make an array of Dictionary objects, one per data column, to convert string keys to int values."
With the array of Dictionary objects in hand, the Convert() function that converts a matrix of type string to a matrix of type int uses this approach:
create a result matrix of int
  loop each row of string matrix
    loop each col of string matrix
      let s = curr value
      use Dict array [col] to find int value of s
      store int value at row, col of result matrix
    end-loop
  end-loop
  return the result int matrix
The array of Dictionary objects converts a string value to an int index. It's not necessary to do reverse lookups from an index value to its associated string value.
Using Category Utility for Clustering
Because a CU value indicates how good a clustering of data is, at first thought you might think that you could repeatedly try random clusterings, keep track of their CU values, and then use the clustering that gave the best CU value. Unfortunately, the number of possible clusterings for all but tiny datasets is usually unimaginably large. The number of different ways to cluster n items into k clusters is given by an equation called a Stirling number of the second kind. For the hair-country-sex example above with n = 5 items and k = 2 there are just 15 possible clusterings. But for n = 100 and k = 20, there are a bit fewer than approximately 20^100 possible clusterings which is about 1.0e+130. This is a number far greater than the estimated number of atoms in the visible universe (1.0e+82). That's a lot of possible clusterings.
In pseudo-code, my algorithm to cluster n data items into k clusters using category utility is:
initialize k clusters with one random item each
loop each remaining n-k data items
  compute CU values if item placed in each cluster
  assign item to the cluster that gives largest CU
end-loop
This technique can be called a greedy agglomerative technique because each decision is based on the current best CU value (greedy) and the clustering is built up one item at a time (agglomerative).
This algorithm initializes by selecting k data items at random. After that the algorithm is deterministic. It is critically important that the first k data items selected are different because once a data item is assigned to a cluster, that assignment never changes.
The Cluster() method initializes the k clusters using a helper function GoodProcessOrder() which uses this approach:
    generate a random processing sequence
    compute how different 1st k items in sequence are
    loop initIter times
      generate new random processing sequence
      compute how different 1st items in sequence are
      if new sequence is more different
        save new sequence
      end-if
    end-loop
It's not entirely obvious how to measure the dissimilarity of a set of k data items. The approach I use is to add the number of distinct values in each column. For example, suppose there are n = 20 data items and k = 3 clusters as in the demo program. One possible random sequence is (12, 5, 17, 0, 9 . .7) which means place data item [12] in cluster 0, item [5] in cluster 1, and item [17] in cluster 2. Then take item [0] and place it in the cluster that gives the best CU value. Continue with the remaining 16 data items and then all items will be assigned to a cluster.
Suppose items 12, 5 and 17 in their unencoded form are [12] = (red, small, hot), [5] = (red, medium, mild), [17] = (red, large, hot). The number of distinct values in the color column/attribute is 1. The number of distinct values in the size attribute is 3. The number of distinct values in the temperature attribute is 2. The total number of distinct values for the three data items is 1 + 3 + 2 = 6. A set of k data items with a large number of distinct values is more likely to be different than a set of k items with a smaller number of distinct values.
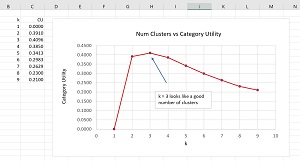
When using most clustering algorithms, including the one presented in this article, the number of clusters, k, must be specified in advance. Determining a good number of clusters must be determined by trial and error. One way to help in finding a good value for k is to try different values of k and then graph the CU value for each clustering.
 [Click on image for larger view.] Figure 3: Graphing k vs. Category Utility
The graph in Figure 3 shows this technique for the 20-item demo dataset. The CU for k = 1 is 0.0 which makes sense because you gain no information by placing the entire dataset into one cluster. From the graph, it looks like the values k = 2, 3, and 4 are the best.
The code that generated the data for the k-vs-CU graph is:
for (int k = 1; k <= 9; ++k) {
  CatCluster c = new CatCluster(data, k,
    20, seed:k);
  c.Cluster(100);
  Console.WriteLine(k + " " +
    c.catUtil.ToString("F4"));
}
The code displays k from 1 to 9 and the associated CU of the clustering. I scraped the output from the command shell and dropped the values into Excel to make the graph.
Wrapping Up
The technique presented in this article is intended primarily for non-numeric data, but the technique can be used to cluster mixed numeric and non-numeric data. The idea is to bin numeric data into categories such as "small", "medium", and "large". However this approach has a disadvantage that CU treats the difference between a "small" value and a "large" value the same as the difference between a "small" and a "large" value.
Despite decades of research on data clustering algorithms, there is surprisingly little known about clustering non-numeric data. Alternatives to using category utility for clustering non-numeric data include techniques based on entropy and naive Bayes probabilities. A recent idea, which to the best of my knowledge has not been explored by researchers, is to convert non-numeric data to numeric data using a neural network autoencoder and then use a numeric clustering algorithm such as k-means clustering.