Product Reviews
ANTS Performance Profiler
Discover what your application is really doing-method by method, line by line-with Red Gate ANTS Performance Profiler.
Your application is behaving poorly. You'd think that having written the application yourself, you could diagnose the problem. Unfortunately, any real-world program is complex enough that it's unlikely that even the application author himself can fully understand how the code performs under live fire.
That's where Red Gate Software's ANTS Performance Profiler 5.1 becomes an important part of your toolkit. The tool enables developers to determine where their applications are really spending their time. ANTS Performance Profiler can be used either within the Visual Studio IDE or as a stand-alone application to analyze your application in its runtime environment.
Integration with Visual Studio
After downloading and installing ANTS Performance Profiler, you'll find a new ANTS 5 menu added to the Visual Studio menu bar. For many Windows Forms applications you'll be able to profile your application just by selecting Profile Performance from the ANTS 5 menu. This will start both the profiler and the application. However, not all applications can be profiled directly; Web Projects or Windows Services are two such applications. For those applications, ANTS Performance Profiler must be started as a stand-alone program and attached to the application. I found that when working with complex solutions containing multiple projects, some of which couldn't be profiled directly, I couldn't use the Profile Performance menu choice and had to start the tool in stand-alone mode.
After you start the ANTS Profiler, the Project Profiler Settings dialog displays, allowing you to select the executable you want to profile. You can also attach ANTS to IIS to profile an ASP.NET application or attach it to a Windows Service. You can then start your profiling session, which triggers ANTS to launch your executable.
During the profiling session, ANTS Performance Profiler displays a graph showing key performance variables such as I/O and CPU usage. But it's when you stop your profiling session that the software reveals its full power. In addition to providing you with an overview of where your application spends its time, the tool also allows you to drill down to individual methods and even lines within methods. You can see how many times any method or line was called and how long, on average, each took to execute (see Figure 1).
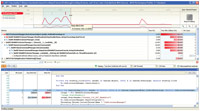
[Click on image for larger view.] |
| Figure 1. The top part of the Profiler window lets you select a time range to review; the middle part provides a high-level overview of time spent in the application's objects; and the lower part lets you look at time spent executing individual lines. |
Customization
ANTS Performance Profiler will probably do everything you need out of the box. However, you can pick and choose which performance measures you're interested in or insert instrumentation into your application to add markers to the log created by the software. You can also have ANTS Performance Profiler keep an updated log of your application's activity, which is useful for problems that only occur when an application is running for long periods of time.
Not every application needs ANTS Performance Profiler. However, if you're not getting the performance or behavior that you want from your application and you're not sure where the problem is, this tool will help you find it.
ANTS Performance Profiler 5.1
Red Gate Software Ltd.
Web: www.red-gate.com
Phone: 866-997 0397
Price: $395; $494 with support and upgrades
Quick Facts: A performance profiler for analyzing performance bottlenecks
Pros: Easy to use with detailed information organized for ready access
Cons: Integration with Visual Studio not fully realized
About the Author
Peter Vogel is a system architect and principal in PH&V Information Services. PH&V provides full-stack consulting from UX design through object modeling to database design. Peter tweets about his VSM columns with the hashtag #vogelarticles. His blog posts on user experience design can be found at http://blog.learningtree.com/tag/ui/.