Product Reviews
dynaTrace Offers End-to-End Multi-Tier Tracing
dynaTrace provides continuous monitoring of your application -- from the client to the database -- without requiring you to insert any instrumentation code.
With most performance, logging and tracking tools you must instrument your application by adding code that writes to a trace log. dynaTrace is different: It inserts hooks into the .NET runtime and passes the information to a separate server for you to review. This architecture allows dynaTrace to, for instance, track a transaction that begins with a JavaScript request -- made through the ASP.NET ScriptManger -- into a Web Service and the middle-tier business objects it calls, and, finally, to the SQL statements issued by your code (or even Entity Framework objects).
dynaTrace uses rule-based tracking that lets you specify what you want to record. You can specify that you want to look at particular packages, methods, application types and more. Out of the box, dynaTrace tracks most everything. You can follow a path through a transaction and also gather "context information" for the transaction: parameter values passed to methods; method's return value; any SQL statements issued to the database, along with any bound values; memory allocated and more. You also get visibility to actions within the methods through any calls made to framework objects.
The dynaTrace client provides multiple views of the data, including various table views and a UML sequence diagram that shows where control is passed off to the application's components.
Integration with Visual Studio is minimal. If you have an app that generates an .EXE, you can launch it with tracing from the Tools menu. From the dynaTrace client, you can navigate from an entry in a view to the related code file in your project.
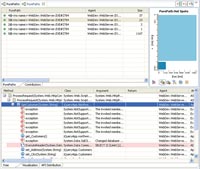
[Click on image for larger view.] |
| Figure 1. A dynaTrace PurePath beginning with a JavaScript call on the client to a Web Service and continuing into the middle-tier business object on the server. The highlighted area shows the SQL statement issued from the middle tier. |
dynaTrace is equally capable in production and development. You can do "diffs" to compare one run of a transaction against another to see if changes have made the app better or worse -- and where. dynaTrace also integrates with Visual Studio Team System for Test, to facilitate comparing different configurations of the same application. Run results are saved to a central repository for shared access.
dynaTrace expects you'll spend a few days working with the company to implement the product. Even working with the excellent support staff, however, I had problems getting dynaTrace to track a transaction involving a Visual Studio Web site: the "projectless" dev model for ASP.NET applications. Looking ahead, dynaTrace has already done proof-of-concept testing on .NET 4 and has a pre-configured package for SharePoint developers, covering WebParts, Lists and CAML.
dynaTrace is an amazing product that helped me understand how my app worked in real-time. If you can afford it, you should be evaluating dynaTrace.
dynaTrace 3.1
dynaTrace software
Web: www.dynatrace.com/en
Phone: 781-674-4000
Price: Developer Edition starts at $10,000
Quick Facts: Zero-instrumentation monitoring of application performance across tiers
Pros: Can track transactions across platforms -- .NET and Java -- and tiers
Cons: Cost; minimal integration with base version of Visual Studio
About the Author
Peter Vogel is a system architect and principal in PH&V Information Services. PH&V provides full-stack consulting from UX design through object modeling to database design. Peter tweets about his VSM columns with the hashtag #vogelarticles. His blog posts on user experience design can be found at http://blog.learningtree.com/tag/ui/.