Inside TFS
Build Execution in Team Foundation Server
Team Foundation Server has a variety of ways to queue and execute your builds. Here's what you need to know.
Once your Team Foundation Build definition has been created, you can use this definition to execute your builds. Builds can be triggered within Team Foundation Build in a variety of ways, including running on a schedule or through the use of Continuous Integration. However, all builds can be triggered manually: either as part of the build definition requirement, or just to test that a build definition performs as needed.
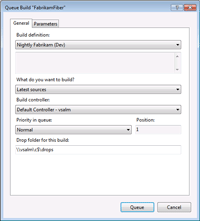
To trigger a build manually, right-click on the build definition in the Team Explorer window and select Queue New Build. This opens the Queue Build window for the build definition, shown in Figure 1. Notice the build definition is pre-selected in the dropdown box. You can change the build definition by selecting the appropriate definition from the dropdown.

[Click on image for larger view.] |
| Figure 1. The Queue Build window in Team Foundation Server. |
You can also choose to build from the latest version in source control, or take the latest version and apply a specified shelveset to the build before it runs. This is called a private build, and can be useful when you want to check that you're including all the changes necessary to perform the build on a different machine before commiting your changes.
When you manually queue a build, you have the option of using a different build controller, if one is available, than the one specified in the build definition. You can also adjust the priority of this build in the controller queue. The priority controls when the build will run on the controller, relative to other queued builds. The Position value shows the current placement of your build in the queue, based off the priority selected. Figure 1 shows Position 1, indicating this build will be the first to execute if submitted. You can also adjust the drop location for this build to be a different file share location from its default.
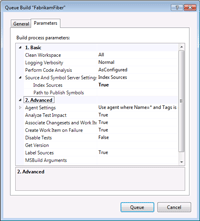
The Parameters tab of the Queue Build window, shown in Figure 2, allows you to control the behavior of the build process. Some of the parameters that can be adjusted include Logging Verbosity, which allows you to control the detail of logging to the build logs, and the Agent Settings, which allows you to determine which build agent is used for this particular build.

[Click on image for larger view.] |
| Figure 2. The Parameters tab allows control of the build process. |
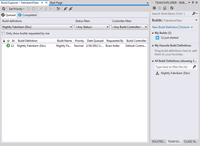
Once all the build settings have been configured, click the Queue button to start the actual build process. To view information about your builds, you can open the Build Explorer tab, shown in Figure 3, by selecting Actions | View My Builds from the Team Explorer window. This window allows you to see all the builds currently executing or awaiting execution, as well as all builds that have finished executing. This window has two tabs: Queued and Completed.
From the Queued tab, you can pause or change build priorities, cancel paused builds and stop builds currently executing. From the Completed tab, you can view details of a build, delete build information or set the build quality of a build. The build quality of a build is a test string that defines the status of that build, such as Ready For Test, or Released. The build quality of a build can impact other processes in your development, such as helping to define what builds are ready for testing, so a best practice is to set the build quality of your builds.
To open the Build Details View of a build, either double-click the build in the Build Explorer, or double-click the build name in Team Explorer, under the My Builds section. This will open the Build Details View, which provides detailed information on the build. This view updates in real time, so you can watch your build while it's running and see what happens. As the build progresses, more information is added to the build log, and hence the build view.

[Click on image for larger view.] |
| Figure 3. The Build Explorer tab shows all builds in process. |
The build view shows all the projects, compilations, test runs, unit test results, code coverage, and test impact data related to the build. It also shows changesets included in the build since the last successful build run of that build definition, along with work item information associated with those changesets. This allows for full traceability of requirements, from the creation of the requirement as a work item, to its inclusion in the build process. And, as you'd imagine, that information is captured in the TFS data warehouse, to allow for reporting and analysis.
As you can see, executing a build definition in Team Foundation Build is a rather straightforward process, and provides a rich, detailed experience around the metrics gathered. By modifying the build parameters before running the queued build, you have the ability to customize the specific instance of the running build to suit your needs.
About the Author
Mickey Gousset spends his days as a principal consultant for Infront Consulting Group. Gousset is lead author of "Professional Application Lifecycle Management with Visual Studio 2012" (Wrox, 2012) and frequents the speaker circuit singing the praises of ALM and DevOps. He also blogs at ALM Rocks!. Gousset is one of the original Team System/ALM MVPs and has held the award since 2005.