Inside TFS
Static Code Analysis in Visual Studio 2013: What's New
Mickey looks at the changes to static code analysis since Visual Studio 2010.
The last time we talked about static code analysis was with Visual Studio 2010 in these two articles: "Static Code Analysis in VS2010" and "Static Code Analysis Configuration." Code Analysis is used to analyze managed assemblies and report any programming and/or design rule violations. These rules are based on the Microsoft .NET Framework Design Guidelines. There are more than 200 rules, broken into different rule sets, which can be used to target specific coding issues.
In this column, we're going to look at some of the changes to code analysis between Visual Studio 2010 and 2013.
First off, static code analysis is now available in the following editions of Visual Studio:
- Microsoft Visual Studio Ultimate 2013
- Microsoft Visual Studio Premium 2013
- Microsoft Visual Studio Professional 2013
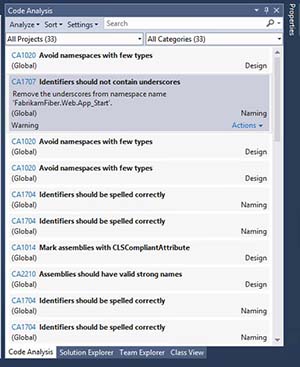
Another difference in code analysis is the user interface. In Visual Studio 2010, the results of code analysis were displayed in the Error List window. In Visual Studio 2012/2013, code analysis has been moved into its own tab, as shown in Figure 1.
 [Click on image for larger view.]
Figure 1. The Static Code Analysis Tab in Visual Studio 2013.
[Click on image for larger view.]
Figure 1. The Static Code Analysis Tab in Visual Studio 2013.
This new windows make it much easier to access and work with the different features of code analysis. The Analyze menu item allows you to run code analysis over the entire solution, or to select a specific project within the solution for which to execute analysis. This new window also provides more sorting options, using the Sort menu option, including:
- Rule ID
- Rule Name
- File Path
- File Name
- Line Number
- Category
This makes it much easier to find a specific rule violation or rule violations related to specific areas of code. You can filter the information in the window by project using the drop-down box in the top left of the window, allowing you to narrow the results down to a specific subset of code.
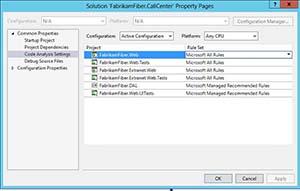
You can use the Settings menu option to access the solution settings for code analysis, shown in Figure 2. This window lets you set the specific rule set that is used by each project in the solution.
 [Click on image for larger view.]
Figure 2. Solution Settings for Code Analysis in Visual Studio 2013.
[Click on image for larger view.]
Figure 2. Solution Settings for Code Analysis in Visual Studio 2013.
Back in Figure 1, you can select a code analysis violation to see the details. In Figure 1, I've selected CA1707 to display the detailed information. It shows the title of the violated rule, the description, whether the rule is an error or a warning, and where in the code base the rule violation occurred. The CA1707 highlighted link is a link to a Web site that displays information about the code analysis rule, including sample reasons why the violation may occur, as well as suggested fixes.
On the right-hand side of the window is a new feature in Visual Studio 2013: Code Analysis Categories. Visual Studio 2013 exposes the categories for native rules, which provides a more fine-grained way to group defects. Categories can be particularly helpful with a large list of warnings, which can otherwise be overwhelming. Categories also let developers focus their efforts on the categories most relevant to the problem trying to be solved. You have the option to filter by category using the search box at the top of the window, or by selecting a specific category from the drop-down box in the top right of the window.
In addition to these new features, the static code analysis accuracy results were improved and multiple bugs were fixed.
Code analysis is a strong tool in your code arsenal to help find potential issues in your code that aren't compile-time issues. The changes and updates from Visual Studio 2010 to Visual Studio 2013 have made this tool both more accurate and easier to use, letting developers write more solid code.
About the Author
Mickey Gousset spends his days as a principal consultant for Infront Consulting Group. Gousset is lead author of "Professional Application Lifecycle Management with Visual Studio 2012" (Wrox, 2012) and frequents the speaker circuit singing the praises of ALM and DevOps. He also blogs at ALM Rocks!. Gousset is one of the original Team System/ALM MVPs and has held the award since 2005.