In-Depth
7 More Top Tips for Visual Studio 2013
Part 1 presented six top tips for Visual Studio 2013. Part 2 wraps up the series with seven more tips that every developer needs to know about the latest version of the Visual Studio IDE.
- By Deborah Kurata
- 03/07/2014
More on This Topic:
Every new release of Visual Studio advertises that it increases developer productivity. But with Visual Studio 2013, you might just find the marketing to be true! Visual Studio 2013 comes with many new features that can really change the way you work.
This is part 2 of a two-part series covering 13 tips for improving your productivity with Visual Studio 2013. Enjoy!
Tip #7: Edit and Continue with 64-Bit Applications
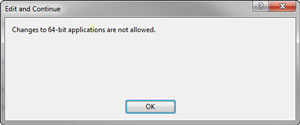
One of the most disliked dialogs in prior versions of Visual Studio occurred when you tried to edit while debugging an application, as shown in Figure 1.
 [Click on image for larger view.]
Figure 1. The dreaded Edit and Continue dialog from prior versions of Visual Studio.
[Click on image for larger view.]
Figure 1. The dreaded Edit and Continue dialog from prior versions of Visual Studio.
This significantly reduced your productivity because it required you to stop debugging, make the change, recompile, re-run the application, and navigate back to the feature you were testing.
With Visual Studio 2013, you can now edit while debugging a 64-bit application and continue your debugging session. This dialog is gone -- I'm sure you'll join me in saying, "good riddance!"
Tip #8: Profile Your Application with the Performance and Diagnostics Hub
The Visual Studio profiling tools help you measure, evaluate, and resolve performance and resource issues in your code. If you used any of the profiling tools in prior versions of Visual Studio, you might have noticed they were scattered, divided, leaderless. In Visual Studio 2013, there is one that can unite them: the new Performance and Diagnostics hub. The new hub makes it easy to work with the profiling tools and identify which tools work with your specific type of project.
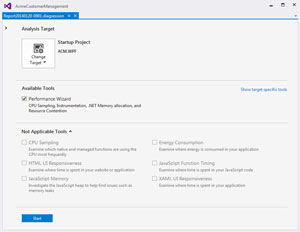
The Performance and Diagnostics hub is available from both the Debug and Analyze menus. When you select the Performance and Diagnostics option from the menu, a diagnostic session is started and a dialog is displayed, as shown in Figure 2. As you can see, the Analysis Target is a Windows Presentation Foundation (WPF) application. Use the Change Target dropdown to change the analysis target to a different project in your solution.
 [Click on image for larger view.]
Figure 2. The new Performance and Diagnostics hub.
[Click on image for larger view.]
Figure 2. The new Performance and Diagnostics hub.
In the hub, only the tools appropriate for the selected analysis target are available, so only the Performance Wizard is available in this example. A link on the right allows you to Show all tools or only Show target-specific tools. In Figure 2, all the tools are displayed for your reference.
The tools currently provided in the Performance and Diagnostics hub include:
- Performance Wizard: This tool was available in Visual Studio 2012. It's the only profiling tool currently available for desktop and server applications, including Windows Forms applications, WPF applications and ASP.NET.
- CPU Sampling: This tool was available in Visual Studio 2012. It collects statistical data about your app's CPU usage.
- HTML UI Responsiveness: This tool was introduced in Visual Studio 2012 Update 2. It helps you find UI-responsiveness problems in JavaScript Windows Store apps.
- JavaScript Memory: This tool was introduced in Visual Studio 2012. It helps you understand your memory usage and find memory leaks in JavaScript Windows Store apps.
- Energy Consumption: This tool is new in Visual Studio 2013. It helps you estimate your app's energy consumption, which is important when building apps for devices.
- JavaScript Function Timing: This tool was available in Visual Studio 2012. It uses instrumentation to collect detailed timing information about your JavaScript function calls.
- XAML UI Responsiveness: This tool is new in Visual Studio 2013. It helps you find and resolve UI responsiveness issues in C# or C++ XAML Windows Store apps. This tool does NOT work with other types of XAML applications, such as Silverlight or WPF.
Even though many of the hub's tools aren't new, the idea of grouping all profiling tools in one place and enabling only the tools valid for a specific project is new. We can expect to see more tools in this hub over time.
Tip #9: Get Assistance with Debugging Your Asynchronous Code
Asynchronous code is great for building responsive applications, especially Windows Store apps. But asynchronous code can adversely affect your productivity during the debugging process. It's hard to see the flow of asynchronous code and difficult to understand its state while debugging.
Visual Studio 2013 added two features to assist you when debugging asynchronous code: enhanced Call Stack window and enhanced Tasks Window. These features are available when building applications using native code (C++), JavaScript and managed code (.NET languages). However, these features rely on technology built into Windows 8.1, so they're only available if you're running Visual Studio under Windows 8.1.
When debugging, the Call Stack window has always displayed the list of calls that were made to get you to the current code location. When stopped at a break point, the Call Stack basically answers the question: "What path through the code got me here?" When debugging asynchronous calls, the Call Stack now includes additional stack frames to aid in understanding how the code navigated into an asynchronous continuation.
The Parallel Tasks window introduced in Visual Studio 2010 was renamed to the Tasks window in Visual Studio 2013 and enhanced. It displays the status of all active asynchronous operations. It answers the question: "What's going on in my application right now?" From the Tasks window you can navigate to any of the active asynchronous operations. Note that even though "tasks" are called "promises" in JavaScript, the tool is still called the Tasks window when debugging JavaScript.
Use these new features to improve your productivity any time you need to debug your asynchronous code.
Tip #10: Mix and Match ASP.NET Technologies with One ASP.NET
With Visual Studio 2013, all of the many ASP.NET technologies have been unified into One ASP.NET to rule them all. (Yes, the "Lord of the Rings" analogies must continue … how could one resist, precious?)
This unification provides Web developers with flexibility. In prior versions of Visual Studio, you had to pick one set of technologies. Is the application going to be Web Forms or ASP.NET MVC? If it's ASP.NET MVC, is it Web API or Single-Page Application (SPA)? Now, with Visual Studio 2013, you can easily combine options to build applications that take advantage of the best of each technology. Or you can easily add technologies to existing applications. For example, you can add Web API to a Web Forms application.
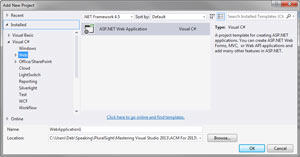
The unification is first apparent in the new Web project experience. When you add a new Web application to a solution, you get only one template, as shown in Figure 3.
 [Click on image for larger view.]
Figure 3. Only one Web project template is provided.
[Click on image for larger view.]
Figure 3. Only one Web project template is provided.
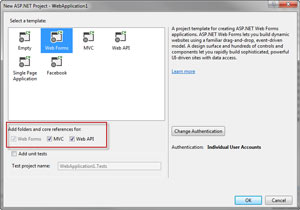
After selecting an ASP.NET Web Application, you can pick a primary template and add folders and references for other technologies using the checkboxes under the template selection. For example, you can pick Web Forms as the primary template, but add folders and references for MVC and Web API, as shown in Figure 4. Or you can pick MVC and add folders and references for Web API.
 [Click on image for larger view.]
Figure 4. Pick a primary template and add folders and references for additional technologies.
[Click on image for larger view.]
Figure 4. Pick a primary template and add folders and references for additional technologies.
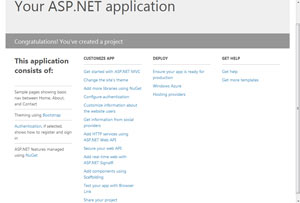
Visual Studio then displays a project readme file that assists you with many common tasks (see Figure 5). Follow the links for help with tasks such as adding application themes, adding NuGet libraries, configuring authentication and testing with the new Browser Link.
 [Click on image for larger view.]
Figure 5. The project readme file generated by Visual Studio provides links to common tasks.
[Click on image for larger view.]
Figure 5. The project readme file generated by Visual Studio provides links to common tasks.
Use this enhanced experience to configure the combination of technologies (and unit tests) whenever you build an ASP.NET application.
Tip #11: Generate Web Code with Scaffolding
The new scaffolding features for Web Forms, MVC and Web API generate code for you. Depending on the technologies you choose and the options you select, it can generate all of the code for you. How's that for enhancing your productivity?
For example, you want to build a page that performs basic create, read, update and delete (CRUD) for a customer. If you already have a customer class, Visual Studio can generate the page code for you.
Start by right-clicking on the Web project and selecting Add | New Scaffolded Item. Then select the desired scaffolding. If you select "MVC 5 Controller with views using Entity Framework," Visual Studio will generate all of the code to support the CRUD operations. It generates a model that's based on your selected business object class and Entity Framework (using an .mdf file it creates in the App_Data folder). It generates a controller that provides the CRUD operations, and it generates a set of views for create, delete, details, edit and an index (or list) of the items.
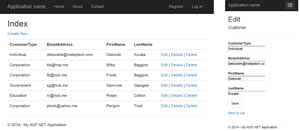
Without writing a single line of code, I added a Web project to an existing solution. I set a reference from the Web project to my existing business layer, which has a Customer class. I used the Add | New Scaffolded Item, selected my existing Customer class and, voilà, I have a set of operational pages (see Figure 6)!
 [Click on image for larger view.]
Figure 6. Automatically generate pages using the new scaffolding features.
[Click on image for larger view.]
Figure 6. Automatically generate pages using the new scaffolding features.
Check out the scaffolding features and see what you think.
Tip #12: Use the New Web and XAML Editor Features
If you've done any coding with HTML or XAML, then you've probably wished for more code-editing features all other languages have, features like IntelliSense Everywhere and Go To Definition. With Visual Studio 2013, this wish has come true.
Visual Studio 2013 includes a new HTML editor with many new features such as Expanded Attribute IntelliSense, IntelliSense for Entities (such as ), Id and Class Name IntelliSense, automatic brace completion and improved formatting.
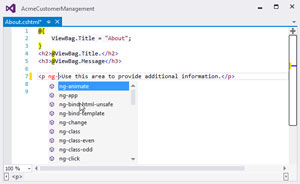
HTML IntelliSense was unified into a single schema focused on HTML5-centric usage. In addition, it includes attributes for jQuery UI, Knockout and AngularJS (shown in Figure 7). To prevent the IntelliSense list from become unwieldy, groups of attributes (such as the Angular attributes in Figure 7) are grouped. The groups are collapsed in the IntelliSense list until you expand them by selecting or typing the prefix, such as "ng-" in this example.
 [Click on image for larger view.]
Figure 7. IntelliSense now displays AngularJS attributes.
[Click on image for larger view.]
Figure 7. IntelliSense now displays AngularJS attributes.
The updated XAML editor includes IntelliSense for resources and binding expressions, Go To Definition for resources and binding expressions, start/end tag refactoring, better commenting support, and code snippets. These improvements are for all XAML-based types of applications, including Silverlight, WPF and Windows Store apps.
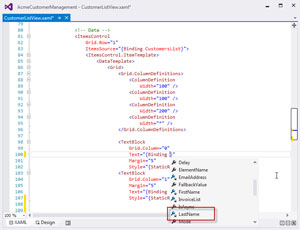
Figure 8 displays the IntelliSense list of valid values for the binding expression. A unique icon differentiates the Binding properties from the bindable properties of the current data context.
 [Click on image for larger view.]
Figure 8. The IntelliSense list of valid values for the Binding expression.
[Click on image for larger view.]
Figure 8. The IntelliSense list of valid values for the Binding expression.
For more information on the XAML IntelliSense features, read my blog post.
Use these new features to make your HTML or XAML editing more productive.
Tip #13: Synchronize Your Settings
It seems everything is "in the cloud" these days, so it's only appropriate Visual Studio would leverage the cloud to deliver a more personalized experience and offer new capabilities.
To this end, the first time you launch Visual Studio (and only the first time), you're presented with a Sign-in dialog. You'll be asked to sign in using your Microsoft account. If you have an MSDN account, that's the best account to use. Otherwise, if you have a Team Foundation Service account, use it. Or any Microsoft account such as outlook.com or live.com.
Your sign-in connects you to your Visual Studio profile, including your Team Foundation Service account as appropriate. The first time you connect, it automatically registers your copy of Visual Studio.
After the first time, every time you open Visual Studio it will automatically connect and synchronize your Visual Studio settings across all your devices. The synchronized settings include keyboard shortcuts, Visual Studio appearance (theme, font and so on) and more. You can adjust and customize the synced settings using Tools | Options, as shown in Figure 9.
 [Click on image for larger view.]
Figure 9. Define which settings to synchronize in Tools | Options.
[Click on image for larger view.]
Figure 9. Define which settings to synchronize in Tools | Options.
Because I primarily use my laptop for presentations, I didn't want to synchronize my appearance or Text Editor settings, so I turned them off. Select the settings you wish to synchronize based on how you work across your devices (desktop, laptop, tablet device and so on.)
Visual Studio 2013 can indeed improve your productivity. Try it out and let me know what you think.