Visual Studio Toolbox
11 Code Profiling and Performance Tools for Visual Studio
Performance optimization may be the root of all evil, but these tools simplify the process of wringing the best performance out of your code.
- By Terrence Dorsey
- 07/10/2015
Performance optimization in software development can be a deeply polarizing issue among programmers. On the one hand, too much attention to performance tweaking rabbit holes has been known to send software projects spiraling off course and schedule. On the other hand, small problems replicated across large systems can become crippling bottlenecks ... or worse.
Add to those conflicting options the fact that many software engineers I know find the siren call of solving a subtle problem difficult to resist. Balancing the need to ship versus the value of extracting more stability and efficiency is a constant tension.
Fortunately, there are some great tools that take the drudgery and guesswork out of profiling and performance testing your code.
Back in the July 2011 issue of MSDN Magazine, I compiled a roundup of some pretty amazing "Tools and Techniques for .NET Code Profiling." It's been four years. As you'll see, the tools have improved and there are even more choices.
AMD CodeXL
The AMD CodeAnalyst Performance AnalyzerI covered back in 2011 has now been replaced by the new and expanded AMD CodeXL debugging and profiling suite. As before, it's aimed at tuning code for AMD CPUs, GPUs and APUs and provides GPU and CPU profiling, as well as static OpenCL kernel analysis.
AMD provides standalone CodeXL profilers for Windows 7, Windows 8 and Linux. There's also AMD CodeXL extension for Visual Studio 2010, 2012, and 2013 that integrates the GPU and APU debugging and profiling capabilities right into your development environment. The old AMD CodeAnalyst Performance Analyzer extension is still available, as well.
JetBrains dotTrace
JetBrains dotTrace has come a long way in the last four years and now comprises an entire suite of code execution tracing and performance analysis tools. You can still run tracing, sampling or line-by-line analysis on both local and remote systems. dotTrace supports the Microsoft .NET Framework up to version 4.5.2, Silverlight 4 or 5 standalone desktop applications, Web applications, Windows Communication Foundation (WCF) services, and more. New features include timeline profiling and SQL query profiling.
Note that the alternate download location, through the dotTrace extension Visual Studio Gallery page, provides a really clear, concise overview of the product. Start there if you're curious, then head over to the JetBrains site if you decide to download or purchase.
JetBrains currently offers a time-limited free trial and a number of licensing options, including the full-tilt ReSharper Ultimate package, which includes ReSharper, dotCover, dotTrace, dotMemory, as well as ReSharper C++, all in one license, for a significant discount.
RedGate ANTS
Red Gate ANTS Performance Profiler and ANTS Memory Profiler are another set of commercial tools that profile .NET executables, ASP.NET applications and Web services in IIS, IIS Express, and Web Development Server, SharePoint 2007 or 2010 collections, Silverlight applications, Windows services, and COM+ applications.
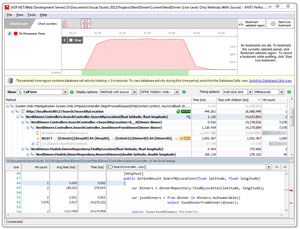
ANTS Performance Profiler (Figure 1) lets you analyze any .NET-supported code base, as well as HTTP request profling, storage IO, and data access profiling, with support for SQL Server, Oracle, MySQL, MariaDB, and PostgreSQL.
 [Click on image for larger view.]
Figure 1. Red Gate ANTS Performance Profiler
ANTS Memory Profiler lets you snapshot memory usage in your .NET applications, Garbage Collection routes, unmanaged memory usage and more.
Both tools support .NET Framework 1.1 to .NET Framework 4.5, any language supported by the .NET Framework, and Visual Studio 2005, 2008, 2010, 2012, and 2013. See the Red Gate site for trial versions and pricing. There's also a free ANTS Profiler Visual Studio Add-in extension that lets you access both Performance Profiler and Memory Profiler directly from Visual Studio. It works with both trial and licensed versions of the applications.
Telerik JustTrace
In 2013, Telerik acquired EQATEC and, thus, EQATEC Profiler, which I mentioned in the MSDN Magazine article, is now part of the Telerik JustTrace .NET memory and performance profiler. JustTrace offers two modes of Performance Profiling, a Sampling Profiler for lightweight analysis and a Tracing Profiler that collects CLR events for more intensive analysis. It also includes Memory Profiling for capturing .NET instance allocation snapshots.
JustTrace integrates with Visual Studio 2013, 2012, 2010 and 2008, and also works as a standalone profiler. Telerik offers a 30-day trial and per-developer licensing, and JustTrace is also available as part of the DevCraft tool suite.
Visual Studio Performance and Diagnostics Hub
Don't forget that there are excellent profiling and debugging tools built right into Visual Studio, and now grouped together in the Performance and Diagnostics Hub in Visual Studio 2013, as introduced in this blog post by Microsoft's Dan Taylor and a Channel 9 video with Robert Green and Andrew Hall.
The Performance and Diagnostics Hub includes the familiar Visual Studio Profiler along with some new tools including JavaScript Memory analysis, HTML UI Responsiveness, and XAML UI Responsiveness for Windows Store apps, Energy Consumption, CPU Usage, and Memory Usage. In addition, JavaScript Function Timing and Performance Wizard from Visual Studio 2012 have been updated and included in the new hub. Because these tools are now all available through the hub, you can run several tools together a single profiling session with combined and cross-correlated results.
You can still run analysis tools from the Performance and Diagnostic page in Visual Studio 2015, and the same tools are carried over from Visual Studio 2013. There are some debugging and diagnostics enhancements in Visual Studio 2015 including cross-platform debugging support for JavaScript-based Apache Cordova projects, as well as C#-based Xamarin and Android projects.
Other improvements include the ability to step through lambda expressions in Watch windows, Visual Studio Remote Tools to run, debug, and test an application running on a different computer, built-in network diagnostics for HTTP traffic data, PerfTips: Performance Information at-a-glance while Debugging with Visual Studio, and more.
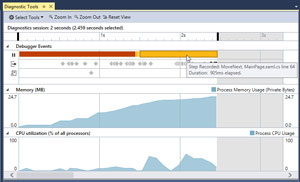
Many of these new tools are brought together in the powerful Diagnostic Tools debugger window in Visual Studio 2015 (see Figure 2), which combines the Output window, IntelliTrace historical data, and tools from the Performance and Diagnostics hub.
 [Click on image for larger view.]
Figure 2. PerfTips Performance History Analysis, Part of Diagnostic Tools in Visual Studio 2015
All up, that's a pretty slick setup right out of the box. But wait … there's more.
More Performance Tools
There are many more specialized profiling and code efficiency tools out there, many of them developed for the community by your fellow programmers and available for free.
The Clr Heap Allocation Analyzer extension is a Roslyn-based C# heap allocation diagnostic analyzer to view explicit allocations, boxing allocations, closure captures, and more. You can run the analyzer as a standalone application or as a code-assist tool within Visual Studio.
Visual Leak Detector for Visual C++ is an open source memory leak detection system for Visual C++ that works with the Visual Studio debugger. Originally developed by Dan Moulding, the project is now maintained by Arkadiy Shapkin.
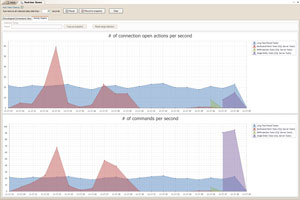
Frans Bouma's ORM Profiler extension (Figure 3) gives you real-time insight into Entity Framework data access code to find performance problems and quickly learn how to fix them. It features online, offline, and production profiling modes, and lets you navigate directly from profiling results to the relevant code in your project.
 [Click on image for larger view.]
Figure 3. Entity Framework Data Access Tuning with ORM Profiler
Don't forget to check and optimize the static assets in your projects. Mads Kristensen's Image Optimizer extension adds a right-click menu to any folder and image in Solution Explorer that let's you automatically optimize all PNG, GIF and JPEG files in that folder.
Finally, something new in the pipeline: Xamarin Profiler is in preview, and will provide profiling tools that work across all of your C# mobile applications. As we go to press Xamarin Profiler 0.16 preview has just been released, so check in to the Xamarin blog and forums for the latest development news.
Better, Stronger, Faster
This is just a taste of the profiling tools available today. There are many more profiling and performance optimization tools out there focused on specific implementation details of specific languages and frameworks. Give these a try, and let us know which are your favorite profilers so we can feature them in future columns.
About the Author
Terrence Dorsey is a technical writer, editor and content strategist specializing in technology and software development. Over the last 25-plus years he has worked on developer-focused projects at ESPN, The Code Project, and Microsoft. Read his blog at http://terrencedorsey.com or follow @tpdorsey on Twitter.