Ask Kathleen
Visual Studio Debug Tips and Strategies (Part 1 of 3)
Improvements in the latest Microsoft IDE and underused features in Visual Studio 2008 support common debugging strategies to help you write better code.
Every developer should know how to use debugging tools to their fullest advantage. This month, I'll give a lightning overview of debugging strategies and show you how Visual Studio 2010 supports them.
Visual Studio 2008 debugging tools are underused, so I'll cover new and existing features. I'm skipping the historical debugger in Visual Studio 2010 Ultimate -- while it's very powerful, it's not available to many developers.
I commonly see four debugging strategies: Help Please, Divide and Conquer, Wandering Minstrel and the Scientific Method. Divide and Conquer determines parts of the application that can be excluded from further consideration. The Wandering Minstrel explores with minimal planning; a debugging episode generally includes many approaches. For years, the Help Please strategy was secondary. Someone looked over your shoulder or you explained the problem and noticed the answer (even if you explained it to your dog). The Internet rocketed the Help Please strategy to front and center. At the same time, increasing quirks and bugs in the Microsoft .NET Framework and Visual Studio require programmers to be good Internet sleuths.
The Scientific Method puts the other approaches in a formal context. Haphazard debugging works on simple bugs. With more difficult bugs, you'll waste time performing meaningless trials, leaving holes in your exploration, staring at the screen hoping for inspiration and, worst of all, getting stuck on an incorrect theory of what's wrong.
I wrote about debugging with the Scientific Method years ago with Nancy Folsom, who introduced me to the concept. You gather theories -- notions of what the problem might be -- and perform a series of experiments with a clear goal for each experiment. The critical nuance is that you design your experiment to disprove your idea, or theory, of what's wrong. Creating theories integrates other strategies: checking the value returned from a Web service (Divide and Conquer) or articulating a gut feel (Wandering Minstrel).
The biggest change in my thinking about debugging in the past few years is the importance of intuition. Gathering theories sometimes involves stepping carefully through the possibilities, but more often relies on your intuition. Intuition is rooted in your knowledge, but unfortunately it encourages you to become infatuated with your expectations. The formality of the Scientific Method offsets this tendency. Experiments to prove your theory is false are a psychological release because you're never wrong -- your theory survives another test or your experiment succeeds. Perhaps more important than the psychology is the nature of truth -- it can rarely be proven. I'll let you meditate on the philosophical aspects of science, truth and expectations. I'll stick to the pragmatic implications of debugging. The key route to efficiency is minimizing time on invalid paths. Your goal is to articulate as many theories as possible, achieve a definitive failure on almost all of them as quickly as possible, rinse, lather and repeat. Until you fix the bug, experiments against your code could succeed for multiple reasons. But if it fails, it fails and you can quickly go on.
Q: How does Visual Studio 2010 support debugging?
A: Debugging features of Visual Studio allow you to do experiments with your code. You phrase theories in your mind -- out loud if working with someone else -- and with a record for complex nasty bugs. Then you look for the quickest way to disprove your idea -- often the first one you think of. The job of Visual Studio is to make that easy, assuming you can reproduce the error on your machine.
The two most important experiments to disprove invalid theories during debugging are whether a piece of code runs and the current state, or the current values of variables and fields. Breakpoints and tracepoints determine whether a particular line of code runs. It's easy to forget about conditional breakpoints, hit counts and breakpoint filters. Once you're interested in a piece of code, it's nice to know how you got there. Visual Studio 2010 extends the call stack with a parallel thread-based call stack.
Tracepoints are perhaps the most underused debugging feature. Since the beginning, programmers have done Printf or Console.Writeline debugging, but these mechanisms affect the code for everyone working on the project. Tracepoints are stored in your user files, and thus affect only your instance (assuming you don't share the user files in source control). The tracepoint dialog explains the content you can include in tracepoints. You can record the value of any state visible to the code and display a half-dozen important system states such as the method name, calling method, thread or even the full call stack.
The big changes to breakpoints and tracepoints in Visual Studio 2010 are that you can label, search, export and import. While I don't think you'll use the export/import feature often, the scenarios where you'll use it are the tricky ones where you want to share part of your debugging process. The sad fact is that certain aspects of code are more problematic than others, and you can also export and save tracepoints and breakpoints for particular problem scenarios.
Searching and labeling help you organize breakpoints. I tend to leave certain tracepoints and breakpoints in place during development in problematic locations. Labeling groups of related points allows you to search for them, then enable or disable them as a group. Each point can have multiple labels, thus appearing in multiple groups.
Once you find an interesting location, you may want to step through code. It's easy to forget about the "Step into specific," "Step over properties and operators" and "Set next statement" options on the right-click context menu, or that you can navigate by double-clicking the call stack.
Improved DataTips
The second big aspect of questioning your code is checking the state. You have multiple routes -- the immediate window, Watch Window and Locals Window. You also have DataTips, which are displayed when you hover over a variable. Starting with 2010, you can now pin the DataTips. As you hover, you'll see a pin on the right side of the box. Clicking on it pins the DataTip, or you can right-click the tooltip and select Pin to Source. Once the DataTip is pinned, you'll see a small vertical toolbar as you hover over the DataTip. The pin in this toolbar allows you to unpin the DataTip from the source code to create a floating DataTip. Pinned DataTips stay with the code and will scroll off screen as you scroll your code. Unpinned DataTips retain their relationship with the visual screen. These two types of DataTips are different colors and you can drag both types around with the mouse.
The down-facing chevrons on the DataTips toolbar let you associate a comment with the DataTip. You can use this as a reminder of why you're interested in the tip or a target value you wish to compare. You can remove DataTips individually or as a group using Remove DataTips and Remove All DataTips from file. You can copy the expression or value and later paste them somewhere interesting like a Watch Window. You can also edit values in place within a DataTip. Many of these special DataTip features are available through the context menu, which can be a little tricky to activate. Right-click on a portion of the DataTip other than the value, expression or comment; for example, you might click on the symbol category icon.
But wait, there's more ... DataTips can contain more than one value. By adding expressions, a single floating or pinned DataTip can contain all of your DataTips for a particular context. Unfortunately, you can't drag additional expressions onto the DataTip. If you enter a comment, it will appear once for the entire DataTip, allowing you to express why these values should be considered together.
But wait, there's still more ... You're solving a particular problem, or working in a problematic piece of code. You create a set of DataTips to explore this problem and you think it's solved. Before you delete the DataTips, export them. Assuming you name and store them logically, you can import if you need to return to the problem. They'll often give a clue to some of the theories you explored. You can also export DataTips if you need to pass the problem on to someone else. Unfortunately, this release does not yet offer a way to export a group of DataTips or a way to see the entire list of active DataTips.
If you're debugging a Windows Presentation Foundation (WPF) application, Visual Studio 2010 supplies a special DataTip visualizer.
After the page is constructed, with the DataTip displayed, click the magnifying glass. Figure 1 shows the visualizer for a simple form with a ListBox and Button. You can see the full visual tree on the left, values of the currently highlighted element on the right and a rendering of the elements at the bottom-left.
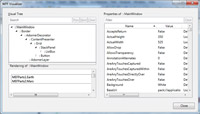
[Click on image for larger view.] |
| Figure 1. The WPF Visualizer is a tremendous step forward in understanding the Visual Tree in your WPF applications and quickly exploring settings on each part. The visualizer won't give full results until the tree is completed; specifically, it won't appear complete when accessed from the constructor. |
Another trick for WPF is to supply specific trace levels to individual controls. If FirstName doesn't exist on the DataContext, you'll get a single error message from commonly used XAML:
<TextBox Text="{Binding Path=FirstName}" />
It provides in the Output Window:
System.Windows.Data Error: 40 : BindingExpression path error:
'FirstName' property not found on 'object' ''MainWindow'
(Name='')'. BindingExpression:Path=FirstName;
DataItem='MainWindow' (Name=''); target element is 'TextBox'
(Name=''); target property is 'Text' (type 'String')
You can specify a different level of tracing with the PresentationTraceSources attached property:
<TextBox Text="{Binding Path=FirstName,
diag:PresentationTraceSources.TraceLevel=High}" />
With the high level of tracing set, and the Tools/Options/Debugging/OutputWindow/WPF Trace Settings set to Warning, you'll see nearly a dozen warnings about this failed binding, as well as the error.
Most programmers spend more time debugging than writing new code, but we spend the majority of our effort improving our development and workflow techniques. Spending time exploring the debugging features of Visual Studio and examining your habits will make you better at debugging.
About the Author
Kathleen is a consultant, author, trainer and speaker. She’s been a Microsoft MVP for 10 years and is an active member of the INETA Speaker’s Bureau where she receives high marks for her talks. She wrote "Code Generation in Microsoft .NET" (Apress) and often speaks at industry conferences and local user groups around the U.S. Kathleen is the founder and principal of GenDotNet and continues to research code generation and metadata as well as leveraging new technologies springing forth in .NET 3.5. Her passion is helping programmers be smarter in how they develop and consume the range of new technologies, but at the end of the day, she’s a coder writing applications just like you. Reach her at [email protected].