Inside TFS
Free Tool for TFS Work Item Visualization
One of the things I like to do with this column is introduce readers to some of the great community tools that have been developed around Visual Studio 2010 and Team Foundation Server 2010. In this column, I want to introduce the readers to a free work item visualization tool.
Visual Studio 2010 includes some nice visualization features that have been covered in previous columns, such as the Architecture Explorer, which can be used to provide a graphical view of code. Data is visualized using the Directed Graph Markup Language (DGML), which allows pretty much any data to be visualized when expressed in this language. Jeff Levinson, co-author of the Inside TFS column, decided to apply DGML to the work item tracking system in Team Foundation Server 2010. What he developed provides some nice visualization diagrams of the work item tracking system, which can make work item information easier to comprehend.
This project can be downloaded from CodePlex. Both the source code and the compiled version of the application are available. When the tool is run, it opens a configuration window, which once configured will create the appropriate DGML visualization file. This tool should be run on a machine with Visual Studio 2010 Ultimate installed, as the Ultimate edition contains the DGML viewer.
There are three ways to utilize this tool:
- State Visualization – Provides a quick and easy way to view the history of a work item.
- Work Item Analysis – Shows all the links into and out of selected work items.
- Dependency Analysis – This was Jeff's primary reason for creating this tool. In this mode, the tool links files from changesets back to top level work items (assumed to be requirements), which allows one to see how changes to a particular file can affect requirements.
State Visualization
Let's start out by looking at state visualization. Double-click the WorkItemVisualization.exe application to start the tool. Before creating a visualization graph, the tool needs to connect to a Team Project Collection and a Team Project. The tool outputs a DGML file which can then be opened in Visual Studio 2010 Ultimate, so an output filename is also required. Figure 1 shows the tool connected to the Tailspin Toys Team Project.
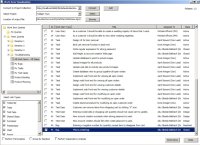
[Click on image for larger view.] |
| Figure 1. Work Item Visualization Tool. |
Once the tool is connected to a team project, a list of all the work item queries in that team project appears in a pane on the left. Double-click a work item query to run the query, and display the results in the right-hand pane.
To visualize the history of a work item, check the box next to a single work item, then click the State button. The work item history will be created as a DGML file, and the file will automatically open in Visual Studio 2010 (shown in Figure 2):
Notice how each state (Active, Resolved, and Closed, for this work item) is shown in a different color. The diagram shows the different states this particular work item has been through in its lifetime, and includes the state information, the reason for being in that state, the person who moved it into that state, and the date/time if was moved. While this same information can be found in the History section on the work item form, this graphical view can be easier to interpret and consume.
Work Item Analysis
Next, let's look at how to create work item analysis visualizations. First, double-click a work item query to return a list of work items in the team project. Next, in the Select Link Types window, select the link types that the tool needs to crawl. Select the work items from the main pane, or click the Perform Full Analysis checkbox to analyze all the work items, then click the Work Items button to generate the visualization (Figure 3).
Notice how in Figure 3 the arrows only go one direction. This is to show how changes to one work item can affect other work items. In creating Figure 3, I also selected the Changesets link type. As can be seen there are two changesets shown in this diagram, along with the files contained in the changesets.
Another option available is the Group by Iteration checkbox, which creates a diagram (not shown) where all the work items are shown contained in their iteration, making it easy to determine what work items are involved with which iteration.
Dependency Analysis
Jeff's primary reason for creating this tool was to perform dependency analysis. By this, we mean being able to see that changes to particular files can be tied back to affect certain requirements. This is different from the standard work item analysis shown in Figure 3. Figure 4 shows an example of dependency analysis. In a dependency analysis graph, files are not grouped by changeset. Instead, every file only appears one time on the graph, with links back to the different changesets containing the file. A file could be associated with many different work items that may all lead back to different tasks and ultimately different requirements. Being able to visualize this association makes it easy to see which requirements will be affected by changing a particular file.
Being able to visualize work item information from Team Foundation Server 2010 makes it much easier to understand and consume the data, especially when dealing with large result sets. Go download the work item visualization tool and give it a try.
About the Author
Mickey Gousset spends his days as a principal consultant for Infront Consulting Group. Gousset is lead author of "Professional Application Lifecycle Management with Visual Studio 2012" (Wrox, 2012) and frequents the speaker circuit singing the praises of ALM and DevOps. He also blogs at ALM Rocks!. Gousset is one of the original Team System/ALM MVPs and has held the award since 2005.