Product Reviews
Tracking Memory Problems with SciTech .NET Memory Profiler
Memory Profiler provides you with the tools to track down both unreleased and unmanaged resources and to find forgotten references that are soaking up memory.
I once wrote a multithreaded Windows Service for a client that had an interesting feature. Over time, it gradually took over whatever computer it was running on -- like some creeping slime monster in a horror movie. With demanding applications, you need to know where your memory is going, even with the .NET Framework garbage collecting runtime. Without a memory profiler, finding the problem would've consisted of making educated guesses.
The .NET Memory Profiler from SciTech Software AB provides all the tools needed to see how an application is using memory both during development and in production. During development, .NET Memory Profiler works as a Visual Studio add-in to support tracking down problems. In addition to viewing real-time memory activity, you can take snapshots of memory usage to compare and analyze with .NET Memory Profiler tools. For production issues, you can run .NET Memory Profiler in standalone mode. From the Profiler dashboard you start an executable or a service and track their memory usage. The .NET Memory Profiler provides special support for profiling ASP.NET, Windows Presentation Foundation and Silverlight applications (both inside and outside of a browser).
That flexibility wouldn't be useful if the Profiler didn't give you what you need in a way that you can use it. In Visual Studio, you're just one click away from real-time memory information or reviewing a snapshot. The real-time graphing tool provides excellent flexibility in deciding what information you want to track. Tooltips on the graph give you quick access to detailed information about the data points.
Debugging memory issues is, however, still a craft rather than a science. If you're new to the field, you'll want to read the .NET Memory Profiler Help information to understand how to use the information the tool provides (and to understand .NET memory management strategies). To support analyzing common memory problems, .NET Memory Profiler includes three wizards that guide you through gathering and interpreting memory-usage information.
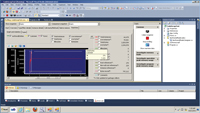
[Click on image for larger view.] |
| Figure 1. Visual Studio Integration. The add-in version of the .NET Memory Profiler integrates seamlessly with Visual Studio to allow you to select and view memory usage of specific classes in your application. |
Test Snapshots
The .NET Memory Profiler also supports test-driven development. You can use the API exposed by Profiler to collect snapshots during a test run. A class library of assertions allows you to check for memory-related issues during testing (that is, you can see if you've successfully disposed of objects created in the test run). When tests fail, the Profiler generates an annotated memory snapshot.
Profiler comes in two versions: Standard and Professional. The Professional version adds the ability to import files of memory information generated by its standalone monitoring tool, NmpCore. NmpCore lets you gather information on one computer (or several) and analyze it on another. The Professional version also includes the ability to attach to already-running processes in a production environment.
In a managed memory environment such as .NET, developers can spend entire careers without running into significant memory problems. The issue is that when you do have a memory problem, you're going to need lots of help to solve it. SciTech .NET Memory Profiler will give you that help and do it for a very reasonable price.
.NET Memory Profiler
SciTech Software AB
Web: memprofiler.com
Phone: +46-706868081
Price: $179 (Standard); $349 (Pro)
Quick Facts: A tool that allows you to track how your application is actually using memory both during development and in production
Pros: A flexible tool with lots of support for debugging memory problems and excellent integration with Visual Studio
Cons: None but, if you're new to debugging memory problems, the Help file is essential to understanding the information provided
About the Author
Peter Vogel is a system architect and principal in PH&V Information Services. PH&V provides full-stack consulting from UX design through object modeling to database design. Peter tweets about his VSM columns with the hashtag #vogelarticles. His blog posts on user experience design can be found at http://blog.learningtree.com/tag/ui/.