In-Depth
Using the Disassembly Window When Debugging C# Applications
Squashing this bug required out-of-the-box thinking, and some Disassembly magic.
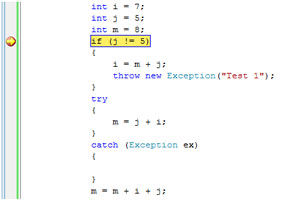
A colleague showed me a perplexing situation he encountered during a recent debugging session. He had used the Microsoft Visual Studio 2008 debugger to find a problem while the program was executing, and he had executed the program one statement at a time. The following information is presented using a relevant simplified example. After stopping at the breakpoint on the line with the yellow arrow and the yellow highlight (see Figure 1), he pressed the F10 key.
 [Click on image for larger view.]
Figure 1. Stopping at the breakpoint.
[Click on image for larger view.]
Figure 1. Stopping at the breakpoint.
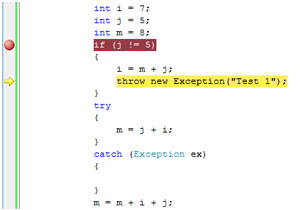
When he saw the result of this action -- a yellow arrow pointing to the line with "throw" -- he was confused. He didn't expect the next statement to be executed would be the one shown in Figure 2.
 [Click on image for larger view.]
Figure 2. After pressing the F10 key once.
[Click on image for larger view.]
Figure 2. After pressing the F10 key once.
Dealing with Visible Misbehavior
We began to analyze what might have caused the "visible misbehavior."
The value of "j" is 5. The expression "j != 5" is false. Control should have been transferred after the {i = m + j; throw new Exception ("Test 1");} block. The statement marked with the yellow arrow in Figure 2 shouldn't have been executed next. We also had another question: Why did the execution jump to the second line in the block?
Our first guess was that the source code and binary code were not synchronized. We recompiled the source code and ran the debugger again. The debugger behaved similarly.
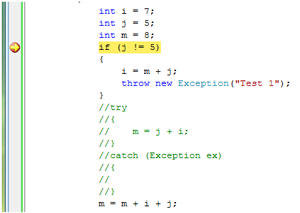
The second guess was that we debugged the release build with optimized code. We checked the project properties and that was not the case. The third guess was that the compiler had a bug and the compiled code was "bad." We commented out a part of the code and recompiled. The results of stepping through the recompiled code are shown in Figure 3 and Figure 4.
 [Click on image for larger view.]
Figure 3. Stopping at the breakpoint of the recompiled code.
[Click on image for larger view.]
Figure 3. Stopping at the breakpoint of the recompiled code.
 [Click on image for larger view.]
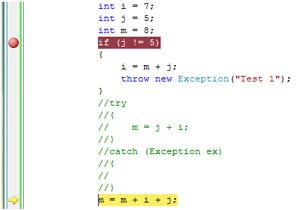
Figure 4. After pressing the F10 key once with the recompiled code.
[Click on image for larger view.]
Figure 4. After pressing the F10 key once with the recompiled code.
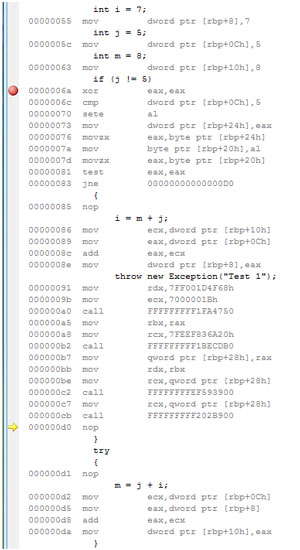
This time, the debugger behaved as expected. To answer the question, "What really changed in the compiled code?" we returned to the original code and stepped with the debugger into the Disassembly window on the instruction level (see Figure 5).
As seen in Figure 5, the line with a "nop" instruction was inserted by the compiler at the end of the "IF" block. The line number is d0, and it's marked with a yellow arrow. When we looked in the source code window at the statement to be executed next, the line #d0 was mapped to the line with "throw." The debugger in the source code window didn't have another choice for where to show the yellow arrow. So the compiled code was OK -- it was the mapping between the source code and compiled code that caused the confusion.
'If' Not, Then What?
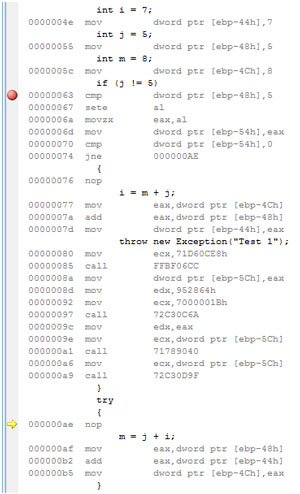
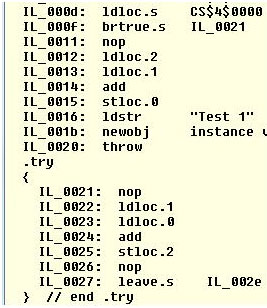
Figures 1-5 show captured snippets for any CPU and x64 platforms. When we recompiled the original code for an x86 platform (Figure 6), we saw that the line with the "nop" instruction wasn't inserted at the end of the "IF" block. It didn't exist at all. We looked at Microsoft intermediate language (MSIL) code for all analyzed platforms, and MSIL code was the same for all platforms (Figure 7).
 [Click on image for larger view.]
Figure 5. The original code (Figure 2) in the Disassembly window.
[Click on image for larger view.]
Figure 5. The original code (Figure 2) in the Disassembly window.
 [Click on image for larger view.]
Figure 6. The original code (Figure 2) in the Disassembly window.
[Click on image for larger view.]
Figure 6. The original code (Figure 2) in the Disassembly window.
 [Click on image for larger view.]
Figure 7. MSIL code for all platforms.
[Click on image for larger view.]
Figure 7. MSIL code for all platforms.
In all presented cases the compiled code was executed as expected; however, the debugger couldn't show the correct next-executed statement because of the way the assembly code was generated.
I personally prefer the compiled code as it appears in Figure 6 because it shows the source code debugger in a more user-friendly manner.
The moral of the story? Verify the execution order in the Disassembly window when you see unexplainable debugger behavior.
About the Author
Boris Eligulashvili is a systems software architect at ViewRay Inc., an image-guided radiation therapy device manufacturer. His career has involved implementing innovative software solutions based on Microsoft technologies. Contact him at [email protected].