Code Focused
Understand Conditional Breakpoints in C++
Standard function breakpoints probably help in most of the debugging sessions. But, sometimes, there's simply too much code to check, too many objects or cases. What if you want to filter out code that generates a breakpoint? Here's a look at conditional breakpoints.
- By Bartlomiej Filipek
- 09/14/2016
Most of the time standard function breakpoints are used. Just set a breakpoint and wait until a particular function is called. But if the code flow is complicated then you can use an additional feature of breakpoints: conditions.
Here's a simple example: What if you try to debug a loop that iterates through 100 rectangles and it seems that big rectangles get somehow corrupted after that loop? Would you debug each iteration of that loop? It might be doable for 10 objects, but not for 100 or 1,000. Maybe you could set a conditional breakpoint and look only at those larger rectangles.
For the code:
// Make a few rectangles larger
// left, top, right, bottom
rects[7] = { 10, 100, 200, 0 };
rects[17] = { 10, 100, 200, 0 };
rects[37] = { 10, 100, 200, 0 };

ScanForInvalidRects(rects);

for (auto &r : rects)
{
  ScanRectangle(r);
}

ScanForInvalidRects(rects);
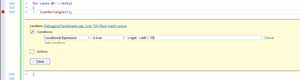
The code appears to be corrupting rectangles with a width greater than 100. So, you set a breakpoint like the one shown in Figure 1 to catch those rectangles.
 [Click on image for larger view.]
Figure 1. Setting Breakpoint To Catch Rectangles
[Click on image for larger view.]
Figure 1. Setting Breakpoint To Catch Rectangles
When you debug such code, the debugger will stop only if the condition is met. You can focus on the problematic cases, and you'll save a lot of time.
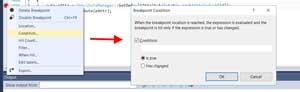
You might notice that in Visual Studio 2015 the dialog for setting conditions and actions is significantly improved. For example, you can open it and still edit the code. Previously (like in Visual Studio 2013, shown in Figure 2) all windows for conditions (Filter, Condition, When Hit) were standard modal windows. Moreover, the whole window is much cleaner now.
 [Click on image for larger view.]
Figure 2. Visual Studio 2013 Settings Window for Comparison
[Click on image for larger view.]
Figure 2. Visual Studio 2013 Settings Window for Comparison
Now that you know how to set up simple conditions, let's go deeper into more advanced uses.
Expression Evaluator -- you can write code inside the condition editor, but what are the rules here? In summary: You cannot call code that has some side effects, creates new variables, new/delete, macros. Unfortunately, it also means that you cannot call a custom function on a given local variable because it changes the current state of the application.
But, for convenience, there are some available intrinsic functions like string ('strlen', 'strcmp', 'strst', ...), system ('GetLastError'), and some math functions.
The full list of expressions you can use in conditions is listed in the MSDN article, "Expressions in the Debugger ."
That's not all.
As a last resort, if you need to create an advanced condition that isn't possible through conditional breakpoints, you can use custom code to do it. You could write a condition in your code and if the condition is met, call the DebugBreak function. Of course, it needs to be recompiled every time you need to make a change.
By default conditional breakpoint windows let you enter a predefined condition of your local variables, but there are other types of conditions:
* Hit Count: Breakpoint will be triggered after a given iteration counter, such as every fifth time, or only at the 10th time or after 100 iterations.
* Filter: Allows filtering of breakpoints on given machine, process or thread.
Although not a condition, in the same breakpoint configuration window you can specify an "action" that will be executed when a breakpoint is hit. For example, you can just print a variable value or current stack. This might be very handy because it means you can dynamically insert print/trace statements without recompiling the code.
With conditional breakpoints you can focus on specific problems and cases. This is especially important in situations when there are a lot of objects to scan or a lot of events. Understating conditional breakpoints can save you a lot of time.
The example code can be found in my GitHub repository.
About the Author
Bartlomiej Filipek is a software developer in Poland who specializes in C++, Windows and graphics programming. He worked for a number of companies developing multimedia, document editors, games, graphics drivers and flight planning systems, and has taught game development at local university. Follow Bart's blog at http://www.bfilipek.com and on Twitter @fenbf.