News
Python in Visual Studio Code Update Adds Debugger, Debugpy 1.0
The new Debugpy debugger for Python in Visual Studio Code hits version 1.0 in the latest update of the Python tooling for the open source, cross-platform code editor.
Python for VS Code comes with the Python extension in the editor's marketplace, which has been installed a whopping 26.6 million times, making the most popular tool in the marketplace by far.
Microsoft updates the VS Code Python tooling regularly, and in March announced Debugpy, which just hit version 1.0 status, according to an Oct. 28 blog post.
Debugpy offers a great number of features that can help you understand bugs, errors and unexpected behaviors in your code," said Luciana de Melo e Abud, program manager. "You can find an extensive list on our documentation, but check below for some of our favorite ones!" (Note that the documentation link wasn't working for this reporter at press time.)
The post goes on to describe three ways of debugging:
Debug web apps: The tool supports live reload of web applications, Django and Flask apps, for examples. So when edits are made to an application, a restart of the debugger isn't required to apply them, because the web server is automatically reloaded in the same debugging session upon changes being saved.
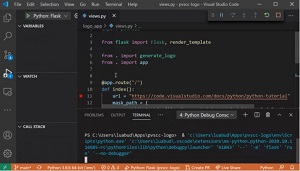 [Click on image for larger, animated GIF view.] Live Reload in Animated Action (source: Microsoft).
Debug local processes: Developers can choose to attach debugpy to one of a list of local process that can be displayed. If a process ID is already known, it can be added directly to the "Attach using Process Id" configuration in the launch.json file.
Debug remotely: This can be done in two ways:
- Remote Development Extensions -- "You can use debugpy to debug your applications inside remote environments like Docker containers or remote machines (or even in WSL!) through the Remote Development extension. It allows VS Code to work seamlessly by running a light-weight server in the remote environment, while providing the same development experience as you get when developing locally."
- Remote attach -- "You can also configure the debugger to attach to a debugpy server running on a remote machine. All you need to provide is the host name and the port number the debugpy server is listening to in the remote environment."
The post also lists a couple of notable changes:
- Fix exporting from the interactive window. (#14210)
- Do not opt users out of the insiders program if they have a stable version installed. (#14090)
About the Author
David Ramel is an editor and writer at Converge 360.