C# Corner
ASP.NET Core 5 Microsoft Power BI Reporting
Eric Vogel provides step-by-step instructions to create an ASP.NET 5 Core web app in Visual Studio 2019 and embed a Power BI report in it.
Today I'm going to cover how embed a Power BI report in an ASP.NET 5 Core web app. We'll start out by creating a new web app, and then I'll detail how to embed your Power BI report in it.
We'll get started by creating a new ASP.NET Core 5 MVC Web App in Visual Studio 2019 as seen in Figure 1.
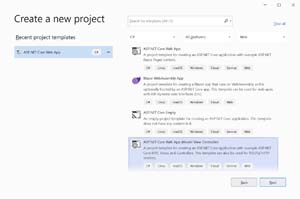 [Click on image for larger view.] Figure 1: Create New ASP.NET Core 5 MVC Web App
After that give a name to the web application as seen in Figure 2.
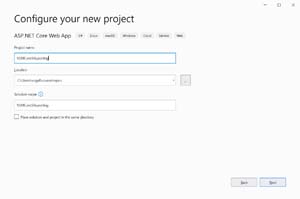 [Click on image for larger view.] Figure 2: Naming Your ASP.NET Core 5 App
On the next dialog select .NET 5 as your target framework as seen in Figure 3.
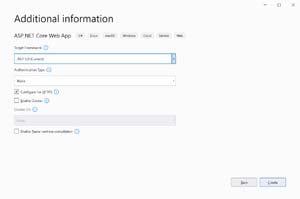 [Click on image for larger view.] Figure 3: Select .NET 5 Framework
Next click the Create button and you will have a new ASP.NET 5 Core web app that has a Razor page named Index.
Now that we have our web app created, let's get our Power BI report created. In order to create a Power BI report you'll need to create a Power BI account. I'll be using a new trial account for our demo report. Note that as of now you need a work email address to sign up for a Power BI account.
You should now see the Power BI dashboard where we'll create a new report as seen in Figure 4.
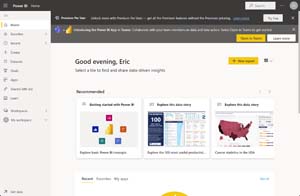 [Click on image for larger view.] Figure 4: Power BI Dashboard
Click on the New report button. You should now see the screen in Figure 5 where you can pick your data set. Pick the Paste or manually enter data option.
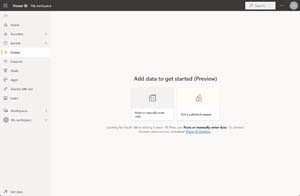 [Click on image for larger view.] Figure 5: Pick a Dataset for Our Report
Now we'll enter some test report data in a Customers table as seen in Figure 6.
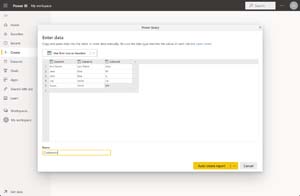 [Click on image for larger view.] Figure 6: Creating Test Report Data
Then click on the Auto create report button. Power BI will come up with some auto generated reports that aren't very useful, so we'll go to the Datasets tab and select our Customers dataset as seen in Figure 7.
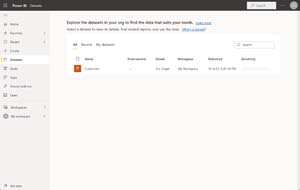 [Click on image for larger view.] Figure 7: Customers Dataset
On the next page select the Create from scratch option that will bring you to a create a report screen. Enter the settings seen in Figure 8.
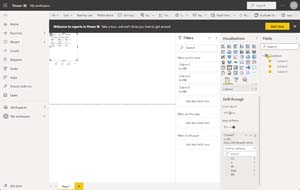 [Click on image for larger view.] Figure 8: Creating our Report
Our test report just displays all of our data in a table with a drill through for the third State column. We'll now save our report through File->Save report and give our report a name of "Customers" as seen in Figure 9.
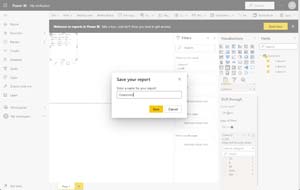 [Click on image for larger view.] Figure 9: Saving Our Report
We are now going to publish our report to the web through File->Embed report-> Publish to web as seen in Figure 10.
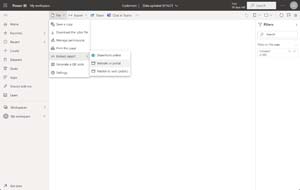 [Click on image for larger view.] Figure 10: Publish Report Embed
Your administrator will have to enable this feature in order to successfully publish your report to the web. If this is your own Power BI account, you can also start a free 60-day trial to enable this feature. You will now see a modal with a link to your report and iframe code to embed the report in your web app. Copy the iframe code now as seen in Figure 11.
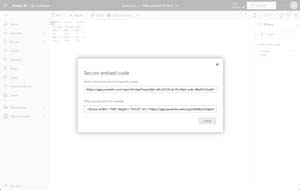 [Click on image for larger view.] Figure 11: Power BI Embed Options
Now it is time to embed our report in our ASP.NET 5 Web App. Open up the Index.cshtml file and put in this markup:
@{
    ViewData["Title"] = "Home Page";
}

<div class="text-center">
    <h2>Customers Report</h2>
    <iframe width="1140" height="541.25" src="https://app.powerbi.com/reportEmbed?reportId=d6c4372b-6c7b-48a5-ac4c-8bd20c9aa0f4&autoAuth=true&ctid=8519dfd5-6e3f-43b7-a4ce-f7c5afbe8ce4&config=eyJjbHVzdGVyVXJsIjoiaHR0cHM6Ly93YWJpLXdlc3QtdXMtZC1wcmltYXJ5LXJlZGlyZWN0LmFuYWx5c2lzLndpbmRvd3MubmV0LyJ9" frameborder="0" allowFullScreen="true"></iframe>
</div>
Replace the <iframe> tag with your custom Power BI Report. You can now run your web app and interact with your report as seen in Figure 12.
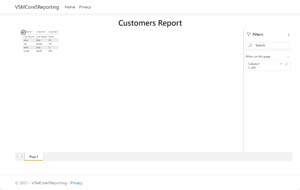 [Click on image for larger view.] Figure 12: Viewing our Report in Our Web App
About the Author
Eric Vogel is a Senior Software Developer for Red Cedar Solutions Group in Okemos, Michigan. He is the president of the Greater Lansing User Group for .NET. Eric enjoys learning about software architecture and craftsmanship, and is always looking for ways to create more robust and testable applications. Contact him at [email protected].