The Data Science Lab
Anomaly Detection Using K-Means Clustering with JavaScript
Dr. James McCaffrey presents a complete end-to-end demonstration of anomaly detection using k-means data clustering, implemented with JavaScript. Compared to other anomaly detection techniques, k-means anomaly detection is simple to implement, simple to interpret, and simple to customize.
Anomaly detection is the process of examining a dataset to find data items that are unusual in some way. The terms anomaly detection and outlier detection are often used interchangeably, but sometimes an anomaly is considered an extremely unusual data item while an outlier is just a slightly unusual item.
There are many different anomaly detection techniques. Each technique has pros and cons. This article explains how to identify anomalous data items using k-means data clustering, implemented with the JavaScript language. The idea is simple: cluster the dataset of interest, then find the data items that are most different from their associated cluster means.
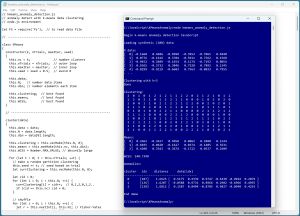 [Click on image for larger view.] Figure 1: Anomaly Detection Using K-Means Clustering in Action
A good way to see where this article is headed is to take a look at the screenshot in Figure 1. The demo program begins by loading a 200-item synthetic dataset into memory. The data looks like:
[ 0] -0.1660   0.4406  -0.9998  -0.3953  -0.7065   0.4840
[ 1]  0.0776  -0.1616   0.3704  -0.5911   0.7562   0.1568
[ 2] -0.9452   0.3409  -0.1654   0.1174  -0.7192   0.8054
[ 3]  0.9365  -0.3732   0.3846   0.7528   0.7892   0.1345
[ 4] -0.8299  -0.9219  -0.6603   0.7563  -0.8033   0.7955
. . .
The leading zero-based indices are for readability and are not stored in the data file. The demo program clusters the data using the k-means algorithm with 3 clusters. The resulting clustering is:
Clustering:
  2  0  1  0  1  2  1  2  1  1  2  2  0  2  1  2  1  0  1  2
  1  2  0  2  1  0  1  2  2  1  2  0  0  0  1  0  2  0  2  0
. . .
  2  1  0  0  2  1  2  2  1  0  0  2  2  2  1  0  1  0  2  1
This means data item [0] is assigned to cluster 2, item [1] is assigned to cluster 0, item [2] is assigned to cluster 1, and so on. The three cluster means are:
Means:
[ 0]  0.2662  -0.3617   0.5050   0.0062   0.2880   0.2144
[ 1] -0.6035   0.0620  -0.1627   0.0374  -0.1405   0.5631
[ 2]  0.4208   0.3543  -0.3674  -0.1722   0.0537   0.2609
WCSS: 240.7398
The WCSS (within cluster sum of squares) is a measure of how well the data has been clustered, where smaller values are better. The demo concludes by finding the most anomalous data item in each cluster:
cluster   idx   distance     data[idx]
-----------------------------------------
  0     [107]   1.6625  [  0.5175  0.4339  0.9747 -0.4438 -0.9924  0.2879 ]
  1     [136]   1.6207  [ -0.0588  0.9731  0.8966  0.2902 -0.6966  0.4955 ]
  2     [138]   1.6812  [  0.1587  0.8494 -0.8705  0.9827 -0.8940  0.4263 ]
For cluster 0, the data item that belongs to the cluster that is farthest from the mean of cluster 0 is item [107] = (0.5175, 0.4339, 0.9747, -0.4438, -0.9924, 0.2879). That item is a distance of 1.6625 away from the mean of cluster 0. For cluster 1, the most anomalous item is [136], and for cluster 2, the most anomalous item is [138].
This article assumes you have intermediate or better programming skill but doesn't assume you know anything about anomaly detection with k-means clustering. The demo is implemented using JavaScript but you should be able to refactor the demo code to another C-family language if you wish. All normal error checking has been removed to keep the main ideas as clear as possible.
The source code for the demo program is a too long to be presented in its entirety in this article. The complete code and data are available in the accompanying file download, and they're also available online.
The Demo Data
The demo data is synthetic. It was generated by a 5-10-1 neural network with random weights and bias values. Because the input data was randomly generated, there are no clearly distinct groups of data items, which makes clustering difficult.
All of the data values are between -1 and +1. When using k-means anomaly detection, the data items should be normalized so that they're all within roughly the same range. The basic k-means algorithm (also called Lloyd's algorithm) measures the distance between items using Euclidean distance. If one variable has large magnitude values, such as employee income, it will overwhelm a variable with small magnitudes, such as employee age.
In practice, k-means anomaly detection is most often used with strictly numeric data. But it is possible to apply k-means anomaly detection to categorical data if you encode the data.
For ordinal categorical data that has inherent ordering, you can use equal-interval encoding. For example, for a variable height with possible values (short, medium, tall), you can set short = 0.25, medium = 0.50, tall = 0.75.
For plain categorical data without ordering, you can use one-over-n-hot encoding. For example, for a variable color with possible values (red, blue, green), you can set red = (0.3333, 0, 0), blue = (0, 0.3333, 0), green = (0, 0, 0.3333).
Binary variables are conceptually tricky. Binary variables can be zero-one encoded (male = 0, female = 1), or one-over-n-hot encoded (male = 1/2, 0 female = 0, 1/2), or simplified one-hot encoded (male = 0.25, female = 0.75), or equal-interval encoded (male = 0.3333 female = 0.6666). The bottom line is that, in practice, any of these encoding techniques for binary variables usually works fine.
Understanding Anomaly Detection With K-Means Clustering
The key ideas of anomaly detection using k-means clustering are shown in Figure 2. The diagram shows a simplified example with just 13 data items and 3 clusters, where each data item has two values instead of the six of the demo data (so that the data can be graphed).
 [Click on image for larger view.] Figure 2: Anomaly Detection Using K-Means Clustering Example Graph
Each cluster has a mean, sometimes called a centroid, or center. The most anomalous data item in each cluster is the one that is farthest from its cluster mean.
There are several variations of k-means clustering. Expressed in high-level pseudo-code, the version used by the demo program is:
    loop n trials
      initialize a random clustering and means
      loop max_iter times or until no change in clustering
        update the clustering based on the means
        update the means based on the clustering
      end-loop
      compute WCSS of new clustering
      if WCSS is best found, save curr clustering
    end-loop
    return best clustering found
The number of possible clusterings of a dataset is astronomically large, and there is no closed form solution that minimizes within-cluster sum of squares. Therefore, k-means iterates a number of trials, with different initializations, keeping track of the best clustering found.
There are three main ways to initialize a random clustering. The Forgy technique picks k randomly selected data items to act as initial means/centroids/centers. The Random Partition technique randomly assigns each data item to one of the k clusters. The k-means++ initialization technique is iterative and uses probability. The demo program uses the Random Partition initialization technique.
The Demo Program
I used Notepad to create the demo program. I like good old Notepad. You will probably want to use a more powerful editor, but any editor will work fine. The program is implemented to run in a node.js environment using a local text file for data. If you want to run anomaly detection inside a web page, you'll have to modify the input and output statements, but the k-means clustering and anomaly functionality can be used as-is.
The overall program structure is presented in Listing 1. All the control logic is in the main() function. All of the k-means anomaly detection functionality is in a KMeans class.
The primary methods that are exposed are the constructor, cluster(), and showAnomalies(). The cluster() method calls primary helpers updateClustering() and updateMeans(). There are seven secondary helper methods: eucDist(), argMin(), areEqual(), matMake(), vecMake(), nextDouble(), nextInt().
Listing 1: Overall Program Structure
// kmeans_anomaly_detection.js
let FS = require('fs');  // to read data file

// ----------------------------------------------------------

class KMeans
{
  constructor(k, nTrials, maxIter, seed)
  {
    this.nc = k;             // number clusters
    this.nTrials = nTrials;  // outer loop
    this.maxIter = maxIter;  // inner loop
    this.seed = seed + 0.5;  // avoid 0

    this.data;
    this.N;   // number data items
    this.dim; // number elements each item

    this.clustering;  // best found
    this.means;       // best found
    this.WCSS;        // best found
  }

  cluster(data) { . . }
  showAnomalies(data) { . . }

  updateClustering(clustering, means) { . . }
  updateMeans(means, clustering) { . . }

  eucDist(v1, v2) { . . }
  argMin(v) { . . }
  areEqual(v1, v2) { . . }
  matMake(rows, cols, val) { . . }
  vecMake(n, val) { . . }
  nextDouble() { . . }
  nextInt(lo, hi) { . . }
}

// ----------------------------------------------------------

function loadTxt(fn, delimit, usecols, comment) { . . }
function vecShow(v) { . . }
function matShow(m, decs, numRows, showIndices) { . . }

// ----------------------------------------------------------

function main()
{
  console.log("Begin k-means anomaly detection JavaScript ");

  // 1. load normalized data from file into memory
  // 2. instantiate KMeans object
  // 3. cluster
  // 4. show clustering results
  // 5. show anomalous data items

  console.log("End demo ");
}

// ----------------------------------------------------------

main();
The demo program begins by loading the source data into memory:
function main()
{
  let dataFile = ".\\Data\\synthetic_train_200.txt";
  let X = loadTxt(dataFile, ",", [0,1,2,3,4,5], "#");
  console.log("\nX data: ");
  let decs = [4,4,4,4,4,4];
  matShow(X, decs, 5, true); // decs, 5 rows, indices
. . .
The arguments to the program-defined loadTxt() function mean, load columns 0 through 5, where data is comma-delimited, and lines beginning with '#' are comments to be ignored. In a non-demo scenario, your data will likely come from a backend database.
Clustering and Anomaly Detection
The demo program prepares the clustering using these statements:
. . .
  let k = 3;
  let nTrials =  k * (X.length + X[0].length);
  let maxIter =  k * (X.length + X[0].length);
  let seed = 16;
  let km = new KMeans(k, nTrials, maxIter, seed);
The number of clusters to use must be determined by experimentation. The number of trials and the maxIter value for the inner loop of the clustering algorithm must also be determined using trial and error. The seed value is used to generate quasi-random integers for the clustering initialization routine. The strange value of 16 was used only because it gave a nice demo output for this article.
The demo concludes by clustering and then analyzing the clustering results to find the most anomalous data item in each cluster:
. . .
  km.cluster(X);
  vecShow(km.clustering);  // show clustering
  matShow(km.means, decs, k, true);  // show means
  console.log("WCSS: " + km.WCSS.toFixed(4).toString());

  km.showAnomalies(X); // show the anomalies
  console.log("End demo ");
}
Wrapping Up
One advantage of a from-scratch implementation of anomaly detection using k-means clustering is that you can easily modify the code. For example, instead of finding the single most anomalous data item in each cluster, you can find the top two or three anomalous items. Or you can find the single most anomalous data item in the entire source dataset.
Anomaly detection using k-means clustering is just one of many anomaly detection techniques. Different techniques tend to find different types of anomalies. Other clustering-based anomaly detection techniques includes DBSCAN anomaly detection and self-organizing map anomaly detection. Another category of anomaly detection techniques analyze source data to generate a math model of the structure of the data, and then analyze reconstruction error to find anomalous items. Examples includes neural network autoencoder anomaly detection and quadratic regression anomaly detection.
About the Author
Dr. James McCaffrey directs the data science and research efforts at Quaetrix, a data analytics company located near Redmond, Washington. Before joining Quaetrix, James was a senior research engineer at Microsoft. James can be reached at [email protected].