In-Depth
An Expert's Take on Advanced Data Visualization and Analytics
Advanced data visualization and analytics have become central to enterprise IT strategies as organizations face rapid data growth from cloud services, software-as-a-service applications, edge devices, and connected systems. These environments generate a mix of structured, semi-structured, and unstructured data in real time, often spread across on-premises, hybrid, and multi-cloud infrastructures.
The resulting complexity has made it harder for teams to assemble timely, trustworthy views of business and operational conditions, even as analytics tooling and budgets expand.
In that context, next-generation visualization is increasingly framed as an end-to-end discipline rather than a front-end reporting upgrade. It spans how data is collected, prepared, analyzed, and presented so that different user groups can explore information quickly, detect trends and anomalies, and act on insights with confidence.
That broader pipeline view set the stage for today's Advanced Data Visualization and Analytics summit, where Greg Schulz, founder of independent IT analyst firm Server StorageIO, discussed approaches for reducing the time it takes to turn raw data into actionable insight, including the growing role of AI and the need to govern it. The two-part summit is being made available for on-demand replay thanks to the sponsor, Developer Express, which also presented at the event.
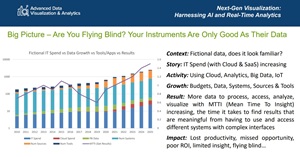
 "New sources of data are flooding rivers that flow into data, lakes and oceans with users having to swim to stay aloft amid the rising tide of data."
Greg Schulz, founder of independent IT analyst firm Server StorageIO
Data Growth and Tool Sprawl Are Outpacing Actual Insight
 [Click on image for larger view.](source: Greg Schulz).
Schulz opened with a simple but persistent reality: IT organizations are collecting more data and buying more tools each year, yet many still struggle to answer basic questions quickly. He illustrated a widening gap between the curves for IT spend, data growth, and tool/application complexity versus the flatter curve representing actionable results. "Automation, for that matter, they're only good as the data they have to work with and act upon," he said, setting the stage for why visibility keeps getting harder even as investments rise.
He introduced a metric for understanding that gap: "We'll throw a new metric at you here, which is mean time to insight, mean time to information, if you prefer." Schulz described mean time to insight as the elapsed time required to gather relevant data, prepare it, analyze it, and present it in a usable form. When that interval stretches out, the impacts trend in the wrong direction: lost productivity, missed opportunities, and weaker returns on analytics investments. For Schulz, next-generation visualization is about reversing those outcomes by speeding up the entire path from data to decisions.
Data Access and Preparation Remain the First Bottleneck
 [Click on image for larger view.](source: Greg Schulz).
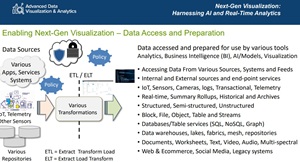
Pivoting from the high-level problem, Schulz identified data access and preparation as the first choke point in any visualization effort. He laid out the challenge of pulling structured, semi-structured, and unstructured data from many sources, then normalizing it into a form that analytics tools can use consistently.
He contrasted traditional ETL approaches, which transform data before loading it into a target system, with ELT patterns that load data first and transform inside modern platforms. In his words, ETL is "the traditional extract transfer form and load," while ELT reflects "another, newer approach… extract the data… import it, load it, and then transform it." Schulz did not frame this as a strict either-or decision. Instead, he noted that many environments use both depending on latency requirements, scale, and tooling.
In practical terms, he stressed that teams have to plan for cleanup work such as removing duplicates, correcting missing or inconsistent values, aligning formats, and adding metadata. He offered a simple example from financial services, describing how even something as familiar as a social security number can become unreliable as a unique key when users accidentally enter dummy values. The broader lesson was to "find and fix the problems in the data" so downstream analytics and visualization rest on trustworthy inputs.
AI Can Accelerate Analytics, But Only With Guardrails
 [Click on image for larger view.](source: Greg Schulz).
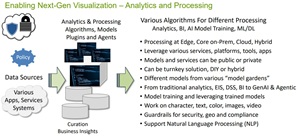
Schulz moved deeper into the pipeline with his "Analytics and Processing" discussion, which positioned AI as a growing part of modern analysis. He described two broad contributions. First, generative AI and natural-language interfaces can help users explore data faster by converting questions into queries, iterating through hypotheses, and summarizing results. Second, non-generative and agentic approaches can assist with anomaly detection, pattern discovery, and automated preprocessing steps that would otherwise require sustained human effort.
However, he emphasized that AI's value depends on trust and control. "It's one of the challenges we see with AI. Generative AI is information that's taken verbatim, taken as just direct output, as is, without vetting it," he cautioned. "Or is the AI hallucinating?" Schulz said organizations need guardrails that define which data AI systems may access, how sensitive information is protected, and how outputs are validated before they are treated as real-world guidance. The takeaway was that AI can shorten time to insight, but only when organizations invest in policies and enforcement that keep AI-driven analytics accurate and secure.
Visualization Must Be Interactive and Story-Driven To Produce Insight
 [Click on image for larger view.](source: Greg Schulz).
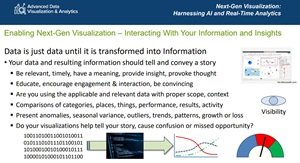
The capstone of the session was Schulz's argument that next-generation visualization is not just about having more chart types, but about enabling exploration that leads users to understanding. "data is just data until it is transformed into information," he said, noting that transformation happens not only through analytics but through how information is presented and interacted with. He used a retail store example to show how insights often emerge through iterative interaction: starting with a high-level KPI, drilling into contributing factors, and comparing anomalies against norms before deciding what to do next.
Schulz emphasized that "Resulting information should tell and convey a story." He contrasted this with static dashboards that present the same view regardless of a user's question. Dynamic dashboards, conversational querying, and role-appropriate interfaces can support both executive-level summaries and deeper analysis for power users. The common thread was that visualization should provide context, highlight trends and outliers, and guide discovery instead of expecting users to manually assemble meaning from disconnected visuals.
Across these themes, Schulz's throughline was that next-generation visualization is an end-to-end effort. Reducing time to insight requires improving the data pipeline, integrating AI responsibly, and delivering interactive storytelling that matches how people actually investigate problems.
And More
Beyond those top topics discussed above, Schulz also covered a range of other key topics. You can learn all about those in the replay.
And, although replays are fine -- this was just today, after all, so timeliness isn't an issue -- there are benefits of attending such summits and webcasts from our sister sites in person. Paramount among these is the ability to ask questions of the presenters, a rare chance to get one-on-one advice from bona-fide subject matter experts (not to mention the chance to win free prizes -- in this case a $300 Best Buy gift card awarded by DevExpress).
With all that in mind, here are some upcoming webcasts coming up from our sister site "Virtualization & Cloud Review" in the next month or so with Pacific times listed:
About the Author
David Ramel is an editor and writer at Converge 360.