Practical .NET
Debugging Tools for the .NET Developer
Visual Studio provides a rich set of tools for finding bugs, though most developers aren't aware or don't take advantage of all of them.
Bugs occur at two stages in a code's life: during development and in production. Development bugs are usually easier to track down because, generally speaking, those bugs are related to code you've written recently (probably in the last hour). Often, we don't even consider errors that appear within 10 or 15 minutes of writing code as bugs -- they're just part of the cost of "writing the code." We're more likely to identify as bugs those problems that appear in production or are the result of code we've written several days ago, probably because they're usually harder to track down (the related code is no longer "top of mind"). Regardless, whenever your code doesn't do what you expect, you have a bug and you need to both track it down and fix it.
4 Pillars of Effective Debugging
There are four supports for effective debugging. One of those is good tools -- which is what this article is about. But those tools won't help unless the other three supports are in place.
The first support for effective debugging is using application design and code practices that favor loosely coupled objects, and then writing what I call Really Obvious Code (ROC rocks!). These practices help you localize bugs and avoid making changes that just introduce new bugs -- and it's never too late to re-read Brian W. Kernighan and P. J. Plauger's "The Elements of Programming Style" (Computing Mcgraw-Hill, 1978).
The second support is using Test-Driven Development (TDD). If you're building anything other than tightly coupled UIs and aren't using TDD, you're programming with one hand tied behind your back: you're less productive than you could be and your code is less reliable than it should be.
The third support for debugging is having a good debugging process (see "The Debugging Process"). Many developers leap straight to the "develop a solution" phase and are, as a result, less likely to fix the bug and more likely to introduce new bugs than those developers who follow a process.
But if those other supports are in place, tools help. To keep the size of this article under control, I'm only going to look at source-related debugging tools and assume that you're not interested in debugging your Microsoft Intermediate Language (MSIL) code.
Exploiting Breakpoints
Many developers aren't aware of all of the debugging features in Visual Studio, because debugging in Visual Studio "just works." For instance, while every Visual Studio developer is familiar with setting breakpoints, many developers aren't aware of what they can do in the Breakpoints window.
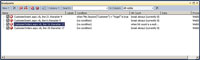
[Click on image for larger view.] |
| Figure 1. The Breakpoints window in Visual Studio. |
To get to the Breakpoints window, select Debug | Windows | Breakpoints; the window will display a list of all of the breakpoints you've set (see Figure 1). If you're not sure which entry in the window corresponds to which line of code, just double-click on any breakpoint to display its related code in the editor.
Once you've found the breakpoint you want, you can control what happens when the breakpoint is hit. I've seen developers, on a breakpoint inside a loop, check the same variables over and over again. By right-clicking on a breakpoint and selecting the When Hit choice, you can have a message printed to the Immediate window each time the breakpoint is hit. You can include some predefined constants -- using $Caller in your message, for instance, will include the name of the method that called the routine containing the breakpoint.
You can also include any of your code's variables by enclosing them in curly braces -- for example, putting {Me.NameTextBox.Text} in the message will display the textbox's Text property. A second option in the When Hit dialog allows you to control whether the execution will stop when the breakpoint is hit. If you have execution stop, you can see each message as it's generated; if you don't stop, you can review all messages after execution completes.
If you only want execution to stop when a particular condition is met, you can use either the Condition or Hit Count options. The Condition option lets you specify a test to have execution stop at the breakpoint if the test is true (for instance, Position > 30). You can also have the breakpoint stop your program if one of your variables has changed since the last time the breakpoint was hit. The Hit Count option causes execution to stop on a breakpoint only when the breakpoint is hit for the nth time (or, alternatively, on every nth hit).
This is especially useful when you want to stop near the end of a loop.
By the way, my experience has been that an area in an application that gives me problems keeps giving me problems. If that's your experience also, Visual Studio 2010 offers some additional features you'll like. You can add a label to your breakpoints to make it easier to remember what it's there for and you can export your breakpoints to an XML file. The next time you need that set of breakpoints, you can import that file and start testing. The import/export facility is available from the toolbar at the top of the Breakpoints window.
Skipping and Exposing Code
I like code generation (I wrote a book on how to do it in .NET). But it normally doesn't do me much good to step through the code that .NET and Visual Studio generate (and it's something that I seem to do more often in Visual Studio 2010 than in previous versions). Stepping through code that doesn't help you localize the problem makes your debugging session less productive and is worth avoiding.
In any version of Visual Studio, in the General node under the Debug heading in Visual Studio Options dialog, you can select the Enable Just My Code option to stop seeing code you didn't write. If you do need to see that generated code -- if, for instance, you have an exception being raised in some generated code -- you can reset the option from the Debug menu's Options and Settings choice.
And if there's some of your own code you're tired of stepping through, you can put one of two attributes on it. Add the DebuggerHidden attribute to a method or property and you'll never step into it again. Alternatively, if you add the DebuggerNonUserCode attribute, you'll step over the code when you've enabled Just My Code and step into it when you haven't. I recommend switching over to using DebuggerNonUserCode and using Enable Just My Code to control access to the members you're tired of seeing.
On the other hand, if you're getting an error thrown from the Microsoft .NET Framework objects, you'll want to step through not only the generated code, but also the .NET Framework classes. You can do that! First, make sure Just My Code isn't enabled. Then, in the Options and Settings menu choice, under Symbols, select the Microsoft Symbol Server (in Visual Studio 2010) or set the path to the symbols file to http://referencesource.microsoft.com/symbols (in Visual Studio 2008). This will position you to download the symbol files that support stepping through the code in the .NET classes. However, you still need to download the symbols. In Visual Studio 2010 you can click the Load All Symbols button in the dialog where you set the option, but you'll have to be patient while the files download.
To be more selective (or if you're using Visual Studio 2008), when in break mode in a debugging session, open the Modules window to display a list of the DLLs loaded by your application. Right-click on the DLL you want and select the Load Modules choice to download the symbols for that DLL. You'll still have to wait for the download, but not nearly as long.
I'm one of those programmers who puts useful code into my properties and, as a result, wants to be able to step through it. Since Visual Studio 2008 SP1, you've had the option to turn off stepping into properties and operators. It appears to be turned off by default in Visual Studio 2010, so if you write property code like I do, you'll want to turn that option back on. You'll find it in the General tab of the Debugging header in Options dialog.
Visualizing the Evidence
Surprisingly, many developers aren't aware of the Visual Studio data visualizers. In break mode, when you hover your mouse over a variable, a DataTip will pop up displaying the variable's current value. You may also see a magnifying icon in the DataTip -- clicking on that magnifying glass will display the value in the data type's default visualizer. If a drop-down list arrow appears beside the icon, clicking the arrow will show you the other visualizers for that data type. A string variable, for instance, can be displayed in the Text, XML or HTML visualizers. For example, if you're storing HTML in a string variable, the HTML visualizer will give you a glimpse of what it will look like when displayed in a browser.
The DataSet visualizer makes it easy to scan through the tables in a DataSet, and the Windows Presentation Foundation (WPF) Tree Visualizer makes it easy to drill down through the components of a WPF control. (I wish a similar tool existed for ASP.NET controls.) There are more visualizers available than the ones that come with Visual Studio, which will be discussed later.
You can also get to visualizers in the Watch, Autos and Locals window; but if you're checking a variable frequently, you can use the pushpin at the end of the DataTip to hold the DataTip in place. The next time you view that part of the code, the DataTip will display automatically.
Speaking of the DataTips, you can also use them to change the value in a variable. In Visual Studio 2010 there's even more: DataTips can be set to float in the window, will persist across debugging sessions, and, after a debugging session is over, will still display the variable's value from the just-ended session. While these tools are limited to Visual Studio 2010, two very cool tools (Debugger Canvas and IntelliTrace) are only available in Visual Studio 2010 Ultimate (see "So Sad: Only in Visual Studio Ultimate").
External Tools
Visual Studio isn't the only debugging tool available -- there are any number of external tools and third-party tools you can add to your debugging toolkit. I'm only going to focus on some of the free ones here.
Not all external tools are from third parties. If you create Windows Services, you know that debugging them can be difficult. While you can attach to a running process to debug it, by the time you attach to a Windows service process, its OnStart and initialization code will have executed. If you have a bug in that code that's preventing the service from starting, you can be reduced to guessing at what's going wrong instead of gathering the evidence you need to describe the problem.
You can configure Just-in-Time (JIT) debugging and Automatic Launch to handle these situations -- a debugging session will start when your service runs into a problem or when the service starts. But you'll have to step outside of Visual Studio to do it.
While setting up JIT debugging is beyond the scope of this article, a Microsoft Knowledge Base article describes what you'll need to do. The article recommends using the Global Flags Editor (gflags.exe); if you can't find it or get it from the Windows Download center, the article also describes how to update the Windows Registry to enable JIT debugging. You will, however, have to learn to use WinDbg (see "WinDbg: Beyond the Visual Studio Debugger").
Third-Party Visualizers
Earlier I discussed the built-in Visual Studio visualizers, but there are more out there. DotNetDan's DataSet Visualizer is really quite wonderful if you need to know what's in a dataset (I mentioned it in a Tips blog entry).
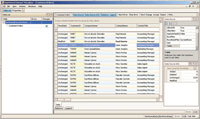
[Click on image for larger view.] |
| Figure 2. The RightHand DataSet Visualizer has a UI that rises to Visual Studio-level sophistication, with multiple windows and menu options. |
I've since discovered RightHand DataSet Visualizer and have switched over to using it (see Figure 2). The RightHand visualizer is an MDI application that lets you open a window for every table in your DataSet. In addition, its Relations window lets you see the tables related to the table you're currently viewing.
The grid used to display each table is smart -- you can drag a column to a bar at the top of the view window to group your data by that column, for instance. You can also update the data in the DataSet and change the view's RowState filter to see only rows in a particular update state -- for example, only deleted rows. You can also view (and play with) some of the properties for the DataSet. You can even write the DataSet out to an XML file or load some test data from a previously saved version of the DataSet.
Having said that, I have to say that DotNetDan's DataSet Visualizer is faster at loading data than the RightHand visualizer, so I keep DotNetDan's around for when I don't need RightHand's power.
Also in the visualizers category is the Web Visualizer for ASP.NET applications. This visualizer is available from the DataTip for any reference to the ASP.NET Page object (including Me and this in an ASP.NET code file).
With Web Visualizer, you can view all the data in the Server object Server Variables collection and from the Request object Forms collection. You can also look at the querystring sent from the browser or list the contents in the Session and Application objects. With the Session and Application objects, however, if you're storing something other than scalar data, all you see is the object's type name.
There are other visualizers available, including ones that allow you to view the Cache and LINQ queries issued against the Entity Framework (EF), and yet another visualizer that lets you see the SQL coming out of LINQ queries against the EF. The only unfortunate thing is that there's no central list of Visual Studio visualizers. Many, but not all, can be found in the Visual Studio Extension Manager.
It includes, for instance, the ASP.NET MVC Routing Visualizer. If you're using routing in either ASP.NET MVC or plain-old ASP.NET, you need this tool. The interactions between the routing rules you set up can yield surprising results ("Why am I getting that page?"), and debugging those rules can be challenging. The Visualizer lets you enter URLs and see how routing will decode them, including which rule will be used for any URL. To use it in break mode, switch to your global.asax file and hover your mouse over a reference to your RouteTable. Once the DataTip comes up, drill down into the Routes collection and click on the magnifying glass icon.
Tracing
Tracing is fundamentally unsexy. However, in production, when you have one of those elusive bugs that's hard to stabilize (one of those bugs that goes away and comes back on its own), tracing is the only way to gather the evidence you need. Tracing first consists of instrumenting your code to write messages to some log file that should give you the evidence you need to stabilize the bug. But for that evidence to be useful, you also need a tool to analyze the file's contents.
While there are lots of tracing packages for .NET developers, I use log4net. Among other features, log4net lets me embed my trace statements in my code, and then activate or deactivate them at runtime without having to recompile my application. One caveat: log4net is a very flexible tool and may be more of a logging tool than you need.
When it comes to reading those log files, I use Log Parser Lizard from Lizard Labs. The free version has some locked features that are only available if you buy the product, which is about $25, but I haven't felt the need yet. Log Parser Lizard uses a SQL-like syntax to query log files (including CSV and XML files) and understands the IIS, Windows event logs and the log4net file formats straight out of the box. The results are displayed in a grid, making it so much like using Server Explorer to view databases that I feel very comfortable with it.
While all of these tools are useful, don't forget that your most important tool is the debugging process. These tools can help you with defining and stabilizing your bug, but, in the end, it's the process that will let you define and apply the solution.