Inside VSTS
Fix Bugs Fast with IntelliTrace and VS 2010
- By Jeff Levinson
- 02/18/2010
One of the major new features for developers that Microsoft is touting is IntelliTrace, formerly known as the Historical Debugger. In this column we will take a look at IntelliTrace and see if it lives up to the hype. For this investigation I'm going to use a simple calculator program that I wrote in WPF. It performs basic math operations, including running totals.
To begin with, the IntellTrace options are located in the Tools > Options menu and the IntelliTrace node. There are several options available in the General, Advanced, IntelliTrace Events and Modules tab. For our purposes we'll stick with the options on the General tab. Here you can enable or disable IntelliTrace -- by default it is enabled. And you can choose to collect only IntelliTrace events or both IntelliTrace events and call information. Essentially, the differences between these two are that the latter option will trace calls down into your methods. This also has the largest performance impact but when we are debugging we want better information not better performance, so we'll turn this on.
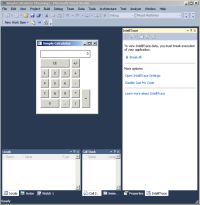
[Click on image for larger view.] |
| Figure 1.The IntelliTrace window visible inside Visual Studio 2010. |
When you begin debugging your application, Visual Studio displays the IntelliTrace window as shown in Figure 1 above. For now I am going to run through a series of calculations that are pretty straightforward. The numbers in parenthesis are what is displayed in the calculator after each button press:
8 (8) + 6 (6) = (14)
7 (7) + 6 (6) - 1 (1) + 9 (9) = (11)
Doesn't make much sense, does it? We appear to have a problem with running totals. My second set of calculations should have produced 7 + 6 - 1 + 9 = 21, but instead I ended up with 11. Not good. To go into the IntelliTrace debug mode, click the Break All button on the IntelliTrace pane. The IntelliTrace pane at this point is shown in Figure 2. This is the IntelliTrace Events view, which shows a series of Gestures. Gestures are the events raised in a WPF application. If this were an ASP.NET application, you would see things like page URLs. This current view isn't too helpful beyond the fact that it recorded the order of the key presses. That in itself is frequently useful but just to us right now.
Clicking the Switch to Calls View link at the top of the pane gives us the view in Figure 3. What is this view telling us? At the top you can see that the main thread of the application is started and the fourth call is to the Run method to actually start processing the code of the application. Beneath this you can see Gestures mixed with method calls which are denoted by a blue sideways "U" shaped icon.
We know from our run that the problem started occurring when the minus key was pressed, so we double-click the SimpleCalculator.MainWindow.btnMinus_Click method. This brings up the view shown in Figure 4. The IntelliTrace view displays the function call that the code was in at that time and displays the IntelliTrace Gutter on the left side of the code window. The gutter lets you move to the previous call (although not in this case because the tracing was just started), next call, return to the live debugging or step into the call.
Stepping into this call we are taken to the PerformMath method, and stepping into this we are taken to the PerformOp method. The Locals window for this method is shown in Figure 5. This shows something pretty interesting -- the [Return value]. It is showing the value that the method returned when it was called at this point in time. Right away we are positive that this is where the problem occurred because it should have returned 13, not 1. Here we come upon a limitation in IntelliTrace -- you can't step into methods except for lines that call other methods because of how the tracing works. But, you can examine all of the variables. It turns out there is a simple mistake with a line in the wrong place in the PerformOp method.
How useful is this really? Remember how you have to debug today? You basically plant about 20 breakpoints in all parts of your application, run the application and keep iterating through until you get to the part where you think the bug occurred. Sometimes you record all of the values up to that point. How long does it take? I remember spending hours tracing some problems and when threads were involved it was a total guessing game. With IntelliTrace you can pretty much find the problem in less than half the time and my guess is that you can find the problem a lot faster than that when compared with today's method of debugging. But wait, there's more!
IntelliTrace is like the gift that keeps on giving. In addition to using IntelliTrace while you are debugging in Visual Studio, you can also save IntelliTrace logs, start an IntelliTrace debugging session and then attach it to a running copy of the application to play back the IntelliTrace events. In this process there is no "Live" state, but you can walk through everything the user did while the IntelliTrace log was running. This is especially helpful when using Microsoft Test & Lab Manager for debugging an application. (See my previous column, Introducing Microsoft Test & Lab Manager TK, for more on this tool).
You don't have to ask what the user did, you can simply step through everything they did. Pretty awesome. In addition you can also search for specific methods to find out how many times they were called and what the output was each time. Very handy when the problem occurred because of or during a run that included many iterations of the same steps.
In this article I have shown a simple glimpse into using IntelliTrace and how you can quickly find and debug problems with applications without setting a single breakpoint. This tool should definitely be part of any developers standard debugging process and maybe even their first tool.
About the Author
Jeff Levinson is the Application Lifecycle Management practice lead for Northwest Cadence specializing in process and methodology. He is the co-author of "Pro Visual Studio Team System with Database Professionals" (Apress 2007), the author of "Building Client/Server Applications with VB.NET" (Apress 2003) and has written numerous articles. He is an MCAD, MCSD, MCDBA, MCT and is a Team System MVP. He has a Masters in Software Engineering from Carnegie Mellon University and is a former Solutions Design and Integration Architect for The Boeing Company. You can reach him at [email protected].