Inside TFS
TFS 2010 Reporting Using Microsoft Excel – Part 1
TFS 2010 uses SQL Server Reporting Services to provide reports, but because it uses data warehouse and analysis services to store reporting information, users can roll their own. In this column we are going to examine how to use Microsoft Excel to access the Team Foundation Server OLAP cube to create a report.
Team Foundation Server (TFS) 2010 contains a rich ecosystem of reporting that users can take advantage of. TFS 2010 uses SQL Server Reporting Services on the backend to provide reports, and ships with over 30 reports out of the box. Because it uses a data warehouse and analysis services to store reporting information, users are not restricted to just the reports that ship with the product. They have the ability to create their own SSRS reports, as well as use other tools to create custom reports.
In this column we are going to examine how to use Microsoft Excel to access the Team Foundation Server OLAP cube to create a report.
Create an Excel Report with the TFS OLAP Cube
TFS 2010, in conjunction with Microsoft Excel, gives users the abilities to create reports against its OLAP cube. This makes it easy to create a report in Microsoft Excel using pivot tables.
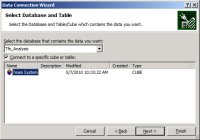
To get started, open Microsoft Excel. Select the Data tab, then from the toolbar select From Other Sources | From Analysis Services. This will start the Data Connection Wizard, which will be used to connect the SQL Server Analysis Services running in the Team Foundation Server installation. First, enter the server name for the SQL Server instance, and select Windows Authentication. In the next window (shown in Figure 1), select the database to connect to, as well as the specific cube or table of interest. For TFS 2010, the database to connect to is called TFS_Analysis.
[Click on image for larger view.] |
| Figure 1. Data Connection Wizard. |
In the data connection wizard, you may see one cube listed, or you may see several. The Team System cube is the main cube representing the entire data warehouse. It will always be present. If you are running SQL Server Standard Edition, it is the only option you will see. If you are running SQL Server Enterprise Edition, you will also see a list of five other perspectives, which provide access to a subset of the warehouse information. Those perspectives are:
- Build
- Code Churn
- Code Coverage
- Test
- Work Item
For the example in this column, select the Team System cube and click Finish to close the Data Connection Wizard.
The Import Data window will open. Using this window, you can select if you want to create just a Pivot Table, or a Pivot Table with a Pivot Chart, as well as a few other options. Keep the default of PivotTable Report and click OK to close the window.
Excel will now open, containing a Pivot Table and PivotTable Field List. By default, the list is set to show all the fields in the cube. For this report, we are going to build a simple remaining work report. As such, we are only interested in work items, so we can filter the list by selecting Work Item in the Show Fields Related To drop down box.
First we will specify the Report Filters. These filters will allows us to control what information is displayed in the report, and drill down to specific information in which we are interested. Under the Date dimension, select Year – Month – Date Hierarchy. Move the column from the Column Labels box to the Report Filter box. Under the Work Item dimension, select Work Item.Area Path and Work Item.Interation Path. Move these from the Row Labels box to the Report Filter Box.
Next, specify the summation values we want to see. Under the Work Item summation dimension, select Microsoft_VSTS_Scheduling_CompletedWork and Microsoft_VSTS_Scheduling_RemainingWork.
Finally, set the row labels. Under the Team Project dimension select Team Project Hierarchy. It will be automatically added to the Row Labels box. Figure 2 shows the PivotTable Field List.
You now have a fully functional simple remaining work report that shows remaining work across team projects over time. This report can be filtered to show remaining work for a specified date, or for specific area and iteration paths. Figure 3 shows an example of the report.
Charts and graphs can be easily added to the report to give it a visual flair. Select the pivot table in Excel, and then in the Excel toolbar, select Options | PivotChart. Select the type of chart desired and click OK. You have now created a chart that is bound to the pivot table information. As different filters are applied to the pivot table, the chart will automatically graph the results. Figure 4 shows the same Excel report shown in Figure 3, with the addition of a chart.
As this column has shown, Microsoft Excel makes it easy to connect to the data warehouse to create pivot table reports. In the next column, we will look at a new feature in Team Foundation Server 2010, the ability to create Microsoft Excel reports from Work Item Queries.
About the Author
Mickey Gousset spends his days as a principal consultant for Infront Consulting Group. Gousset is lead author of "Professional Application Lifecycle Management with Visual Studio 2012" (Wrox, 2012) and frequents the speaker circuit singing the praises of ALM and DevOps. He also blogs at ALM Rocks!. Gousset is one of the original Team System/ALM MVPs and has held the award since 2005.