Product Reviews
ComponentOne Studio for SharePoint
A bundle containing DataGrid, Chart and Maps Web Parts that work with a variety of data sources.
The ComponentOne Studio for SharePoint bundles the company's DataGrid, Chart and Maps Web Parts into one package. Installing the package is simple, and you can decide onto which sites on the server you'll install the Web Parts. To get meaningful error messages when working with these parts, you must also install the Silverlight for Developers download from Microsoft (ComponentOne uses the same code for the SharePoint and Silverlight versions of its Web Parts).
In order to deliver a similar user experience in both SharePoint and Silverlight, the ComponentOne Web Parts don't follow the SharePoint standard when it comes to configuring Web Parts. Instead of the right-hand task panel, the Web Parts use an "on-board designer," accessed by clicking a shadowy icon in the upper-left corner of the Web Part. (The first time the Web Part is displayed you must click a "display the Web Part" button.) Clicking this Edit Web Part button displays a set of design tabs in the space on the page occupied by the Web Part. The designers for the three Web Parts are very similar -- once you know one of them, you'll know all three.
To drive these Web Parts, you can pull data from SharePoint lists, from SQL Server and Oracle databases, and even from Excel spreadsheets. However, to access SQL Server databases -- even on the same computer as the SharePoint site -- I had to turn on Kerberos negotiation for my site. For a remote SQL Server database you may need to make additional changes.
ComponentOne's goal with these controls is to empower users rather than .NET programmers. However, clicking on that shadowy button while holding down the control key opens a text window where you can enter scripting code for the Web Part -- in Python. You can also tie Python code to events that fire when two connected Web Parts are sharing data, and to events in the Maps Web Part that fire when a location icon is rendered or clicked.
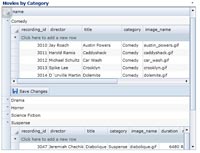
[Click on image for larger view.] |
| The DataGrid makes it easy to create a hierarchical data display that you can set up for your users or let them customize. |
DataGrid, Chart and Maps
The DataGrid has all the features you'd expect. Users can sort, group and freeze columns and filter data. The Grid also supports updates -- either automatically or by requiring the user to click a "save changes" button. It's easy to create a hierarchical data display in the grid, provided that the master and detail tables share a single key. The Chart also offers everything that I'd expect, though there's no facility to count data occurrences of a data item.
For me, the Maps Web Part was the star of the package -- a user-friendly way to start working with geographical data, provided that your data store has saved locations with their latitude and longitude as floats. The customizable control supports geocoding (street addresses, ZIP codes and so on) but you'll need to sign up with Microsoft's Bing map service to use that feature.
These are three solid Web Parts and worth adding to your SharePoint site.
Studio for SharePoint
ComponentOne LLC
Web: www.componentone.com
Phone: 800-858-2739
Price: $1,300 to $6,500, based on the number of site users. The Web Parts can also be bought separately.
Quick Facts: Three solid Web Parts for SharePoint to display data in a grid, chart or map.
Pros: Easy to use and configure with a comprehensive set of features.
Cons: Non-standard UI configuration model for SharePoint; scripting requires knowledge of Python.
About the Author
Peter Vogel is a system architect and principal in PH&V Information Services. PH&V provides full-stack consulting from UX design through object modeling to database design. Peter tweets about his VSM columns with the hashtag #vogelarticles. His blog posts on user experience design can be found at http://blog.learningtree.com/tag/ui/.