In-Depth
Load Testing with Visual Studio 2010
- By Benjamin Day
- 07/12/2010
Web tests allow you to simulate a user performing a set of operations - typically a defined use case - on your ASP.NET Web application and validate the responses to see if the application is working as expected. Once you have your Web tests defined, you can knit them together to create Load Tests to see how well your application performs under stress. Whereas a Web test simulates a single user, a load test simulates many users.
In part 1 of this series, Web Performance Testing with Visual Studio 2010, I focused on authoring and debugging Web tests. In this article, I'll explain how to create load tests and set up and configure a Load Test Rig and then connect to the rig in Visual Studio 2010.
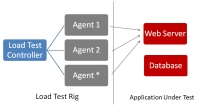
You can run load tests from a developer machine, but you usually can't generate enough traffic to really see how the application responds. In order to simulate a lot of users, you'll set up what is known as a Load Test Rig. A test rig is made up of a Test Controller machine and one or more Test Agent machines as shown in Figure 1. The controller manages and coordinates the agent machines and the agents generate load against the application. The test controller is also responsible for collecting performance monitor data from the servers under test and optionally from the test rig machines.
[Click on image for larger view.] |
| Figure 1. Load test rig and application under test |
Set Up Your Test RigTo set up your test rig, you'll need to have at least two machines -- one for the controller service and one for the agent service. You might be wondering why we're splitting the controllers from the agents. The primary reason is so you can split the load generation from the monitor and data capture tasks. If you want to generate just a small amount of load, this isn't all that important but when you want to generate a lot of load, you'll need the agents free to send out outbound traffic and not have to worry about them collecting a lot of performance monitoring statistics.
When a load test is running, the controller is gathering a lot of data. Rather than store this data in some kind of custom file structure, it gets stored in a SQL Server or SQL Server Express database.
You'll also need to create two users in your Active Directory domain. For simplicity, let's call these accounts LoadTestController and LoadTestAgent. The rig services will run under these accounts. While Active Directory isn't required, it definitely makes the permissions management process easier once you start adding agent machines.
When you install the Load Test Controller service, the installer creates three local groups on the machine: TeamTestAgentService, TeamTestControllerAdmins and TeamTestControllerUsers. TeamTestAgentService should contain all the user accounts that the Agent services will execute. If all your agent services run under the same account, then this group will only have one member -- LoadTestAgent. TeamTestControllerAdmins group contains all the users who are allowed to perform administrative operations on the rig such as adding/removing agents and cleaning up stored performance data. TeamTestControllerUsers includes the users who are allowed to run load tests using the rig and view the results of load tests.
Installing the Load Test Agent service is the easiest part of the rig installation. Make sure that the controller service is running and then all you have to do is run the installer, provide the service credentials (e.g. LoadTestAgent), and the name of the controller. Repeat this process for each load test agent machine.
Connect to Your Test Rig
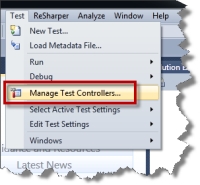
Once you have finished installing and configuring the test rig, verify that it's working and start using it by connecting to it through Visual Studio. (Note: the screenshots for this article are using Visual Studio 2010 Ultimate Edition Beta 2.) Once Visual Studio is running, go to the Test menu and choose Manage Test Controllers (Figure 2).
[Click on image for larger view.] |
| Figure 2. Connect to the test rig via Manage Test Controllers |
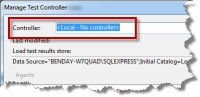
The first time that you visit the Manage Test Controller dialog, you'll see that the controller value is set to <Local - No controller> (Figure 3). This option shows you the configuration for executing load tests from your local machine without the use of a rig. It allows you to change the database that will be used to store load test results for this configuration.
To connect to your test rig, enter the name of the controller machine in the Controller textbox and press enter. If all goes well, you should see the test results database configuration details for the controller and the status of any attached agent machines (Figure 3). If all doesn't go well, you may see an error indicating that Visual Studio cannot connect to your controller. This usually means that the controller service isn't running or that Windows Firewall is blocking network traffic to port 6901 on the controller machine.
[Click on image for larger view.] |
| Figure 3. Local-only load test execution |
If you are able to connect to the controller but find that one or more of the agent machines shows a status of Disconnected, you're once again probably dealing with either the agent service being down or with network connectivity or firewall problems between the controller and the agent machine. (Note: When I'm running a rig in a virtual environment or behind a trusted corporate firewall, I tend to live dangerously and simply turn off the firewall on the machines in my rig.)
Create a Load Test
At this point, hopefully, you've got your load test rig configured and you can connect to it. Now you need something for it to do. Begin with a Visual Studio Test Project and create some Web tests, which will eventually serve as the basic building blocks of your load tests.
Data-driven Web tests help to make Load Tests really worthwhile because the rows in the data source are used by the Load Test Agents to simulate virtual users executing similar use cases against the application but with different data. A load test that sends the same data to the server again and again probably isn't a great test.
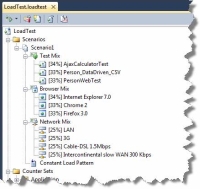
To add a Load Test to your Visual Studio Test Project, right-click on the test project and choose Add Load Test from the Add section of the context menu. This will bring up the New Load Test Wizard that will walk you through the process of creating a load test out of your existing Web tests. In Visual Studio 2010, the wizard lets you configure options such as user load type, simulated network speeds, browser types, and test duration (Figure 4).
[Click on image for larger view.] |
| Figure 4. Load test and load test scenario configuration |
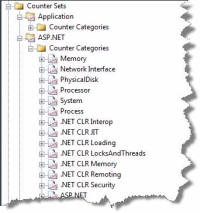
It also allows you to choose which Windows Performance Monitor counters you want to have your load test controller collect while the test is running (Figure 5).
[Click on image for larger view.] |
| Figure 5. Load Test Counter Set configuration |
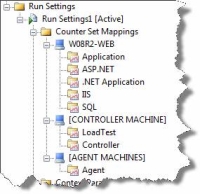
The Counter Sets section of the Load Test defines the list of all Performance Counter sets that will be captured and analyzed as part of the test. The Run Settings Counter Set Mappings section defines which counter sets are collected from each machine (Figure 6). For example, if you have a Web server machine running IIS that talks to another machine running SQL Server, you want to collect the IIS and .NET Application counters from the Web server and SQL Server counters from the database machine. At the end of the test, you'll see how well the servers are performing at various points throughout the test.
[Click on image for larger view.] |
| Figure 6. Load test counter configurations for each server |
Run the Load Test on the Load Test Rig
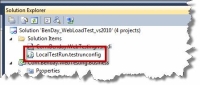
During development, you can run your load test using just your local developer machine but when you're ready to start throwing some serious load against your application, it's time to turn to your load test rig. To get started you'll need to edit your test run configuration, localtestrun.testrunconfig (Figure 7). You might not have even noticed it because it's hidden in the Solution Items folder in your Visual Studio solution. Double-click on localtestrun.testrunconfig to bring up the configuration editor.
[Click on image for larger view.] |
| Figure 7. LocalTestRun.testrunconfig in the Solution Items folder |
Double-click on localtestrun.testrunconfig to bring up the Test Settings editor dialog and then click on the Roles section. The roles section allows you to configure how and where your load tests will execute and, by default, this is set to Local Execution.
To run the tests on the test rig, set the Test Execution Method value to Remote execution, choose your load test controller from the Controller list (Figure 8), click Apply, and then click Close.

[Click on image for larger view.] |
| Figure 8. Test configuration roles set to Remote execution |
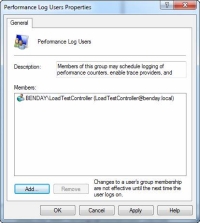
Another thing you need to do before you run your load tests for the first time is to configure performance counter permissions on the machines that you want to profile. Each Windows machine has a local group named Performance Monitor Users (Figure 9). Members of this group are allowed to access the performance counters on that machine. Since the LoadTestController user will be trying to gather these counters, it will need to be a member of the Performance Log Users group on any machine it needs to profile. In our load test, we'll look at counter values on the controller, agent, and Web server/database machine, so LoadTestController needs to be a member of this group on all of these machines.
[Click on image for larger view.] |
| Figure 9. LoadTestController user in the Performance Log Users group |
Once you start the load test, you should see the Load Test in the Test Results window and the status should be In Progress. If you double-click the Load Test in the Test Results window, it will bring up the monitoring screen that allows you to see what's currently happening in you load test.
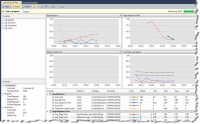
Figure 10 is a screenshot of what you'll see when a load test is running on a test rig. If you think this looks a lot like Windows' PerfMon utility, you're on the right track. This is the display of the Performance Monitor values on all the machines participating in the test plus information about the execution of the load tests and Web tests themselves.
[Click on image for larger view.] |
| Figure 10. Load test execution graphs |
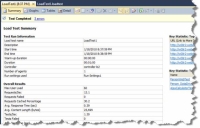
After the load test has finished executing, you have the option to view the Load Test Summary report (Figure 11). This screen will show you the overall results of your load test execution with the ability to drill down to see performance metrics such as average Web requests per second or server health metrics such as memory usage.
[Click on image for larger view.] |
| Figure 11. Load Test Summary Report |
Summary
Web tests and load tests are a great way to help ensure quality and performance of your Web applications. It's always better to test your Web applications early to detect performance problems. If you've determined that you have a performance problem
somewhere in your application, it's extremely helpful to have the ability to capture Performance Monitor metrics for all the machines in your application at once so that you can definitively isolate where the performance problem is actually occurring.