In-Depth
Debugging Applications with IntelliTrace
The new IntelliTrace feature in Visual Studio 2010 promises to eliminate the pernicious scourge of "no repro" bugs by giving developers a detailed view of what happened during execution when a bug was filed. Here's how you can get started with IntelliTrace.
IntelliTrace is a new feature in Visual Studio 2010 that's intended to eliminate "no repro" bugs. You know the ones: the bugs that testers locate and pass on to developers who are unable to reproduce the issues on their machines. These bugs bounce back and forth between developers and testers, wasting everyone's time and sometimes never getting fixed. With IntelliTrace, developers can access a detailed view of exactly what was happening during the execution in which the bug was filed. By providing this information, developers can spend their time fixing bugs instead of looking for them. In this article, we'll take a look at a few examples of how you can get started with IntelliTrace.
First Steps
IntelliTrace is a new technology developed around capturing debugger state during program execution. By default, IntelliTrace is configured to collect information at specific, pre-authored points of interest in the Microsoft .NET Framework. These IntelliTrace events provide information around common development pain points.
For Windows Forms applications, events would include things like menu item selections or button clicks. For ADO.NET, method calls like Execute Reader or Execute Scalar have IntelliTrace events assigned to them. Via the IntelliTrace Events options page you can add or remove a host of other events around areas like threading, tracing, Registry and file access. For each of these events a set of parameters is marked for collection.
Under IntelliTrace, any time your program hits one of these methods the debugger will stop, collect the specified parameters for that event (as well as a small subset of debugger information such as the call stack and currently active threads) and save it to an IntelliTrace file in the background. In addition, IntelliTrace will collect data when exceptions are thrown at debugger stopping points. At exceptions, the exception type and message will be logged, while at debugger stopping points any variables evaluated in the debugger will be collected. Between these collection points, IntelliTrace is configured to capture very useful information at a low overhead to the developer. By default, this mode of IntelliTrace is turned on for any managed applications running under Visual Studio.
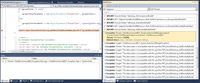
To illustrate how IntelliTrace can save you time, let's take a look at diagnosing Entity Framework DataReader issues in a Microsoft Silverlight, Entity Framework 4.0 and RIA Services Web site solution. In Figure 1 you'll see a picture of the IntelliTrace events window. This window surfaces all of the collected IntelliTrace events, stopping events and exceptions thrown during program execution. It will be shown by default when debugging with IntelliTrace enabled. Clicking on any event in the window will expand the entry to show more data, and the debugging context will sync back in time to the point where that event was collected. If available, the correct source file will be opened for that event location, and an orange arrow will be placed in the breakpoint gutter to indicate your current historical position.
By pressing F5 or selecting the live event at the bottom of the IntelliTrace events window, you'll be taken back to your live context and will be able to resume debugging forward as normal. In this example, the stored procedure was imported into the Entity Framework with an incorrect specification for the complex return type. In the window shown in Figure 1, you can see several ASP.NET GET calls to the RIA service, as well as several successful ADO.NET Execute Reader calls before the failed one. Then, on the call to up_GetResultsByRunIdsNew, we see a thrown and caught IndexOutOfRangeException on the HardEnvironmentID1 property followed by a series of incompatible DataReader exceptions.
[Click on image for larger view.] |
| Figure 1. IntelliTrace clearly shows the thrown exceptions and opens up the source code at the location where the exception occurred. |
In this example, the first IndexOutOfRangeException has been selected. The source code file for that location has opened up, and the debugger context has been placed where that exception was thrown. With IntelliTrace running, you don't have to go through the usual steps of stopping, debugging, turning on first-chance exceptions, and running through the application while stopping at every exception thrown to examine if it could be causing the issue. With IntelliTrace, all that information is at hand as soon the debugger is broken. And, in addition to having all those exceptions listed, you have access to the data contained in the captured IntelliTrace events.
Normally, when working with high-level frameworks such as the Entity Framework 4.0 and RIA Services, the details of execution are hidden from the programmer. But with IntelliTrace, you can peer into Microsoft .NET Framework internals to see details on the ADO.NET Execute Reader events that the Entity Framework is actually generating from the imported stored procedure. When you run into unexplained behavior during a debugger session, look at the IntelliTrace events window and take a look at the events it contains. Even when the answer doesn't jump out from the list, you'll often leave with a better idea about what's happening in the Microsoft .NET Framework while your application runs.
Turning up the Dial
The previous example provides a compelling case for how IntelliTrace can help speed the debugging process, but it really only shows the tip of the iceberg in terms of what IntelliTrace can do. If you navigate back to the Tools | Options | IntelliTrace menu in Visual Studio 2010, there's an option to change from the default IntelliTrace events-only mode to the more powerful IntelliTrace events and call information mode. In this mode, IntelliTrace not only collects data at IntelliTrace events, exceptions and debugger-stopping events, but also collects information on parameters and return values at all method enters and exits. This mode comes with a higher overhead in terms of file size and execution time, but this extra data opens up some interesting avenues for navigating back in time.
The example shown in Figure 2 uses a modified version of the C# card game starter kit and demonstrates the ability to use IntelliTrace to save and share IntelliTrace files after collection. In our scenario, we've received a bug in Team Foundation Server from our tester about an issue in the most recent build of our blackjack card game app. During the normal course of game play, the tester was able to put the player's funds into a negative state, and exceptions would be thrown when the player tried to place a bet of any type. The game was designed to never allow a player to bet more than his or her remaining funds, so obviously something is wrong. Attached to that bug is an iTrace file (the file extension for IntelliTrace files),which is shown open in Visual Studio.
[Click on image for larger view.] |
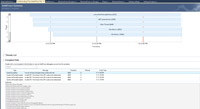
| Figure 2. The IntelliTrace Summary page offers a quick overview of the debugging data captured in the IntelliTrace iTrace file. |
This summary page is shown when an iTrace file is loaded to give a quick recap of the debugging data contained in it. At the top of the page we see a lifetime graph of all the threads in the captured process. Below that are a series of searchable data grids that contain data on the threads, exceptions, test data, system information and modules for that specific debugging session. Even before we start debugging, this summary page can provide some very useful information, which a developer would normally need to ask the tester for. This includes things such as which OS they were using, the bitness of the OS or the screen resolution, as this information is all captured in the system information portion of this file.
In this example, the tester reported that the game allowed him to run a negative balance and then threw an exception while trying to place a bet with that negative balance. On the summary page, we see an exception thrown with the message, "You do not have enough money to make this bet," at the top of the exceptions list. This is a good spot to start investigating; just double-click or select that exception and click the Start Debugging button underneath the call stack. If you don't have a particular exception of interest, debugging can also be started from test events or by double-clicking on a thread in the threads datagrid or in the thread chart.
After the debugger starts up, we're dumped into source as if the System.ArgumentException was selected in the IntelliTrace events window from live debugging. When running in call information mode, a small set of navigation icons will be present on the left side of the source window. These icons allow you to step backward and forward between IntelliTrace data collection points and to step in or out of functions. Normal debugger hotkeys also work for stepping though IntelliTrace data, so pressing F10 will move you forward though collected IntelliTrace data. Note that as IntelliTrace does not capture line-level information, the context will often jump several lines from call site to call site when navigating.
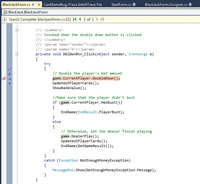
From the tester's description of the bug, this exception is known to just be a side effect; the real issue is that we were able to have a negative account balance in the first place. Checking in the IntelliTrace events list we see that the DoubleDown function was called just before the final call to deal that triggered the exception. Pulling up our source code for BlackJackGame.cs, we can navigate down to the DblDwnBtn_Click function. In the function there's a call to Game.CurrentPlayer.DoubleDown. We suspect this area caused the bug, but it would take quite a while to browse back in time using the stepping function to get our context back to this location.
To help with this navigation, use the provided search feature for the IntelliTrace file when running in call information mode. Right-click on this function to bring up a context menu with two new options, "Search for this line in IntelliTrace" and "Search for this method in IntelliTrace." Selecting "Search for this line in IntelliTrace" will bring up the search bar, shown in Figure 3, and start running a search. As results are found, the first, previous, next and forward buttons in the bar will be enabled, and you can browse between all the times in the IntelliTrace file that this particular line was hit. Note that the same rules apply to this search as apply to stepping, so you'll only get hits when you're searching on a line for which IntelliTrace data was collected. For now, hitting the previous button will bring you back to the second of the two times the DoubleDown function was called.
[Click on image for larger view.] |
| Figure 3. The IntelliTrace search bar lets developers find each instance where a specific line of code was hit. |
The search bar now indicates we're at the second of two results for this line and that we could navigate back to one previous result if so desired. For now, just use the navigation gutter to step in once and then step over once to get our context to the desired location.
The Locals window displays the IntelliTrace data that was collected at our current context point. At method enters and exits, data is collected on the parameters and return values, but due to size and speed considerations some limitations are placed on what we collect. What we do collect is all primitive types in either the parameter or the return value. In addition, we collect all primitive types off of one level of objects that are in the return value or parameters.
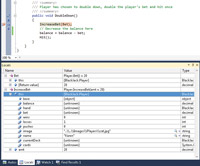
As shown in Figure 4, you can see the values for the BlackJack.Player wins, losses and name, but for references from objects such as the hand field you'll see {unknown}, as that data wasn't collected. In this function, the issue with the balance can be seen as we passed in an increase of $20 to double-down on our bet. After this increase from $20 to $40, we subtracted the full $40 from our account balance instead of just the $20 we added. This dropped our account down into the negative, as we had already subtracted the original $20 when placing the bet (we're only checking our account balance against zero at that initial bet-placing time, not when increasing our bet mid-hand).
[Click on image for larger view.] |
| Figure 4. The Locals window displays IntelliTrace data collected at the current context point. |
Debugging Genius
The ability to move back and investigate parameters and return values with IntelliTrace makes performing rich debugging after the fact a viable approach. In our example, we got information on the exception being thrown, navigated though the functions hit during our program's execution, examined variables and pinpointed the problem all without ever having to actually run the application. And with the iTrace file supplied by the tester, the execution we were debugging was the exact execution path followed by the tester when logging the bug. With IntelliTrace, there was no need for the tester to specify what buttons he clicked to get into the bad state; all the gestures were captured right there in the file.
With the ability to capture and replay a wealth of debugging information, IntelliTrace is a game-changer for debugging managed applications with Visual Studio. Not only can developers debug complex issues faster and easier, but testers can also benefit by providing developers with a debuggable recording of the exact program execution that lead to the crash.