In-Depth
Improving ASP.NET Security with Visual Studio 2010 Code Analysis
Anyone doing ASP.NET development probably admits, openly or not, to introducing or stumbling upon a security issue at some point during their career. Developers are often pressured to deliver code as quickly as possible, and the complexity of the platform and vast number of configuration options can leave the application in a less than desirable security state. In addition, the configuration requirements for debugging and production are different, which can often introduce debugging settings in production, causing a variety of issues.
Over the years, the ASP.NET platform has matured and better documentation has been made available through MSDN and community blogs, but knowing which feature or configuration setting to use is often trouble-some. Even with good knowledge of the security functionality, mistakes can happen that could result in security vulnerabilities in your application.
Peer code review is a useful process and a good way to catch issues early. Still, not every-one has the time or budget -- or knowledgeable peers at hand -- for such review.
Since the introduction of code analysis in Visual Studio 2005, developers have been able to automatically analyze their code to see if it complies with a series of best practices ranging from design, maintainability, performance and security. So far, code analysis has been a great tool, but it hasn't focused on providing best security practice guidance for ASP.NET -- until now.
In this article I'll introduce you to the new ASP.NET code analysis rules that can be used with Visual Studio code analysis as well as with the standalone FxCop appli-cation to improve the security of your ASP.NET applications.
Overview
You can download the ASP.NET security code analysis rules package for Visual Studio 2010 and FxCop version 10.0 from go.microsoft.com/-?linkid=9750555. The installation contains three new rules packages:
- ASP.NET.Security: This category focuses on security best practices related to how System.Web.Ui.Page properties are initialized.
- ASP.NET.MVC.Security: This category focuses on security best practices related to how ASP.NET MVC is used.
- ASP.NET.Security.Configuration: This category focuses on security best practices related to configuration elements under the web.config files.
Once the rules package is installed, you can start reviewing the sec-urity of your Web application automatically by clicking on the Run Code Analysis on Web Site button under the Build menu. The analysis will review each Page class and web.config file of your application against a series of security best practices for ASP.NET.
For example, one widespread security vulnerability in Web applications is cross-site request forgery, which allows an attacker to execute commands as another user. The common mitigation for this vulnerability is to use the Page.ViewStateUserKey property. You can also employ the AntiForgeryToken in ASP.NET MVC. Both techniques prevent a malicious replay attack on your application. The code analysis will make sure that the appropriate mitigation is being used in your application.
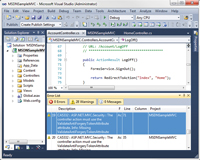
A common bit of feedback I've heard from developers running code analysis for the first time is the overwhelming number of warnings returned (see Figure 1). It's easy to feel like you're on your own to figure out how to fix all of them.
[Click on image for larger view.] |
| Figure 1. Violations are listed in the error list warnings tab. |
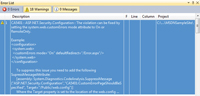
To eliminate some of the burden of addressing each warning, each rule includes a clear indication of what must be fixed and how to fix it, along with some references if you need more information before applying the change (see Figure 2).
[Click on image for larger view.] |
| Figure 2. Detailed information in the warnings section. |
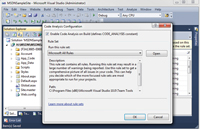
Code analysis can also be configured to run after each build by clicking Website | Configure Code Analysis for Website and then checking the "Enable Code Analysis on Build (defines CODE_ANALYSIS constant)" option (see Figure 3).
[Click on image for larger view.] |
| Figure 3. Enabling code analysis during build. |
Code Analysis with FxCop
The code analysis feature is only available in Visual Studio Premium and Ultimate versions. However, you can also use the standalone FxCop tool to perform ASP.NET code analysis. FxCop is available as part of the Windows SDK. The Windows SDK 7.1 release is available here. When using the standard FxCop tool, a little bit more work is required to perform the analysis. I'll walk you through the steps to get it working.
Normally, when you compile your Web project, the page markup -- the page code not included in a code-behind file -- is not compiled and is left intact in the Web root of your application. When the first user requests the page, the markup is compiled into separate assemblies.
This lets a site be updatable without requiring everything else to be recompiled. (For details about the ASP.NET page compilation process, click here.)
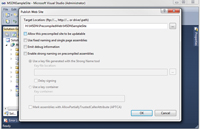
Because not all code is automatically compiled, some of the code isn't visible during analysis and important security issues could be missed. To make sure that all code is available during analysis, you need to force the precompilation of all pages. Precompilation can be achieved by using the Publish Web Site tool, which can be started by clicking Build | Public Web Site. The tool allows you to configure how the Web site will be published, and this is where precompilation can be enabled. Simply uncheck the "Allow this precompiled site to be updatable" option and click OK (see Figure 4). This will result in a fully compiled site ready for analysis.
[Click on image for larger view.] |
| Figure 4. Publishing Web site with precompilation. |
Now that you have a fully compiled site, unleash FxCop on it.
ASP.NET analysis requires functionality that is only available in the command-line version of FxCop, so open a command prompt and navigate to the FxCop installation. This will most likely be one of the following, depending on whether you're running a 32- or 64-bit version of Windows:
  C:\Program Files (x86)\Microsoft FxCop 10.0
  C:\Program Files\Microsoft FxCop 10.0
You can run Fxcop-cmd.exe from the FxCop folder to start your code analysis. For an ASP.NET Web site, use a command like this:fxcopcmd.exe /file:
"H:\MSDN\PrecompiledWeb\
MSDNSampleSite\bin" /rule:
  AspNetConfigurationSecurityRules.dll
  /rule:AspNetMvcSecurityRules.dll
  /rule:ASPNetSecurityRules.dll /aspnet /console
Let's walk through this so you understand the options I'm using.
The /file option indicates what assemblies are to be analyzed. In this example, my precompiled site assemblies are under H:\MSDN\PrecompiledWeb\MSDNSampleSite\bin.
The /rule option indicates which rules to use during analysis. For the purpose of this example, I'm only using three ASP.NET security rules: AspNetConfigurationSecurityRules.dll, AspNetMvcSecurity-Rules.dll and ASPNetSecurityRules.dll.
The /aspnet option enables ASP.NET analysis, and the /console option directs analysis output to the command window.
More information about the Fxcopcmd and its various options can be found here.
Wrapping Up
Making ASP.NET sites more secure can be a difficult task, but the ASP.NET security code analysis rules do a lot of the work for you by identifying some significant threats. As you've seen in this article, the process is simple and can be configured to run each time you build, giving you early identification of issues.
I recommend deploying the rules to each developer machine and also adding them as part of a Team Foundation Sever or other repository check-in policy. This enables individual developers to verify their code at build time and also enforces the policy so that no code can be checked that doesn't meet best practices.
You can also implement your own custom code analysis rules. If you're interested in going down this route, there's some excellent information in a blog post by Duke Kamstra on the Code Analysis Team Blog. You can also find a useful walkthrough of the process on Tatham Oddie's blog.
About the Author
Sacha Faust is a developer on the Microsoft Office 365 platform team. You can follow Faust at blogs.msdn.com/sfaust.