In-Depth
Application Analytics: Why Is the Developer Always the Last to Know?
A look at how developers can use the integrated application analytics capabilities of Visual Studio 2010 to improve software quality.
No relationship can survive without effective and honest communication, and the special relationship that exists between you and your users is no exception. Yet development organizations too rarely exploit the most immediate communication tool at their disposal: their application.
The Agile Manifesto states: "Working software is the primary measure of progress," and that development's "highest priority is to satisfy the customer through early and continuous delivery of valuable software." In that context, measuring development success can be found "at the point of work/play," where users and their applications meet.
Two things must happen to achieve that measurement. First, you need to get your hands on the raw data for analysis. You must have the means to collect, transport and manage application runtime data. And second, the resulting analysis has to yield actionable intelligence. The development framework within which projects are defined and managed should enable organizations to take timely and effective action based on runtime intelligence extracted from runtime data.
Today, with Visual Studio 2010, you have the tools and the technology to do both.
Development Is the Customer
The objective of application analytics is to help you succeed by helping to increase application value and customer satisfaction. As a category, this is what distinguishes application analytics from Web analytics, network monitoring and other neighboring technologies. In Agile parlance, with application analytics, development is the customer.
In good Agile form, one can model application analytics requirements and stories where the developer plays the customer role. Let's take a closer look into some examples where application analytics fits inside common development scenarios.
A "typical" Agile project is planned as a series of iterations. A good practice is to time (or schedule) iterations to help ensure that feedback from early iterations can be used to refine the scope and plans for the later ones. Application analytics shortens the time to gather feedback (potentially reducing the number and duration of required iterations) and improves the quality and precision of that feedback (which ultimately should lead to improvements in the quality of the resulting work).
Of course, applications themselves typically go through their own major "iterations" (versions) and the same pattern holds; application versions should also be spaced to ensure that feedback from earlier versions can be effectively incorporated into future planning.
What might this look like when application analytics are a part of the mix? See "Task: Updating Existing Code," which extends some common Microsoft recommendations for "modifying existing code" to show specifically how application analytics can help.
When real-world usage statistics are placed in the right hands, inside the right tools and at the right times inside the development process, they can enable effective requirements development and user-experience profiling. But if application analytics are so great, why aren't they used everywhere?
The answer is, in part, in the "how" and not the "why." As the cliché says, "if there's no solution, then there's no problem -- it's just life." Runtime analytics have most often been seen as a luxury that most development organizations believe they can't afford (or certainly one they can afford to live without). But the convergence of Web, cloud and mobile computing is challenging the status quo.
Application Analytics Implementation
There's no magic formula for guaranteeing the value of an analytics implementation; value is almost entirely dependent on the specific project and the care taken when deciding which indicators will be most impactful and what responses they'll trigger. But it's possible to focus on the nuts and bolts of implementation, with an eye toward minimizing complexity and managing project risk. When the "cost of knowing" becomes simple, secure and cheap enough, then application analytics move naturally from a development luxury to a development commodity.
The following application instrumentation steps typically take no more than an hour or two, and include support for feature and custom data monitoring, opt-in mechanisms and data security. However, given the particulars around "value," I carefully skirt the tricky bits of prescribing what precisely to collect and what to do about it -- these are questions for the product owners, Scrum masters and architects to settle.
Scope and planning: You need to map objectives and data requirements, as well as identify the specific data fields and how much code may need to be written to meet these requirements. The answers to these questions will be found in the combination of the data requirements and the instrumentation and analytics technologies selected. Table 1 includes common examples.
| Objectives |
Sample Data Points
(Data Worth Collecting) |
Sample Filters
(Data Filter and Query Criteria) |
| Adoption and Activity |
- Unique users
- Sessions
- Session Duration
- Geolocation
|
- Account/user ID
- Geolocation
- Device, OS and CLR
- Application version
|
| UX Improvement |
- Features used
- Feature duration
- Data values (user-entered values or other runtime data bindings)
|
- Feature used
- Feature usage sequencing
- Data values
|
| Quality of Service |
- Exception reports/stack trace
- Hardware stack
- Memory, CPU and IO usage
|
- Exceptions and performance by version, stack and feature usage
|
| User Prof lingand Support |
- Integration with CRM service
|
- User serial number
- Geographic location
|
Table 1. Common runtime data points and pivots.
|
Privacy, identity and security: Based on application functionality, user demographics and defined requirements, identify appropriate privacy policies, communication obligations, opt-in processes and enforcement mechanisms. Again, you must determine coding activities needed to meet these requirements. And, once again, the answers to these questions will be found in the combination of the requirements and the instrumentation and analytics technologies selected.
Instrumentation: What technologies and patterns will be used to modify an application to meet the requirements outlined here? I'm going to restrict that to the instrumentation and application analytics technologies surfaced within Visual Studio 2010 and/or as part of the Windows Phone 7 Developer Tools download (in other words, if you have Visual Studio or are developing Windows Phone applications, all of these tools are included).
Specifically, the remaining implementation steps outlined here use Visual Studio 2010 Dotfuscator Software Services Community Edition or Dotfuscator for Windows Phone and Runtime Intelligence Service for Windows Phone (provided with Windows Phone 7 Developer Tools).
Before I get started, one pattern worth noting is the Dotfuscator injection approach to instrumentation. Rather than rely upon code changes, Dotfuscator injects instrumentation into already compiled code. This is done in two parts. First, using custom attributes or an external XML resource, you specify the following:
- Organizational identity owning the application.
- Application identity (a GUID, a name and version number).
- Opt-in, security and privacy settings used to communicate and enforce privacy settings and, potentially, to secure a user's consent to opt-in.
- Runtime data to be collected, including session, system, feature, custom data, exception reporting and feature-level tracking.
- The target endpoint where the runtime data is sent.
- Additional configuration options including offline caching, SSL transmission, exception reporting and so on.
Second, Dotfuscator injects the code required to implement all of these items into the assemblies -- obviously, all post-compile.
This technique is often effective when analytics need to be implemented inside existing applications or across components and applications developed by multiple teams. It's also useful for targeted user groups that don't typically get a special build (for instance, internal users or other well-defined user segments), or when there's no easy access to the source code or the developers who wrote the code.
Using injection for instrumentation results in the application analytics implementation workflow shown in Figure 1.
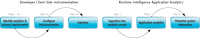
[Click on image for larger view.] |
| Figure 1. High-level application analytics implementation workflow. |
Once the configuration is complete, Dotfuscator will consume assemblies/XAP files and inject the appropriate instrumentation logic. At this point, an application can be optionally obfuscated, signed and packaged with an installation package.
Figure 2 illustrates the next three steps of the application analytics workflow, which include:
- Ingestion of the runtime data into an endpoint.
- Aggregation, analytics and publishing capabilities of a standalone endpoint.
- Additional analytics potential stemming from the integration of runtime intelligence with related systems, including Visual Studio, Dynamics CRM and Operations Manager.
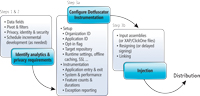
[Click on image for larger view.] |
| Figure 2. Workflow of steps required to ingest, aggregate, publish, distribute and integrate runtime data with the Runtime Intelligence Service. |
Application runtime data streams to an endpoint where it's ingested, managed and published to individuals. It's also surfaced through a RESTful API to facilitate data consumption by other systems, including application lifecycle management (ALM), customer relationship management and IT operations management.
Dashboards, Reports and Extracts
For application analytics to be worthwhile, you must transform runtime data into runtime intelligence. The default Runtime Intelligence Service portal provides summary and detail dashboards, addressing relative application usage by user, by application and version, by location, and across features. Filters make it easier to drill into specific behaviors of application instances and individual users. Custom data fields can reflect anything from the most common search terms or the average time it took for a remote service call to return, to delivering exception data including unhandled, handled and thrown exceptions.
Effective reporting and dashboards can dramatically shorten the time required to identify dependencies. A common feature may be implemented across multiple applications (even using different code), a specific user may run multiple applications, software may be unduly impacted by a particular sound card or CLR version, application behavior may be tied to user data, and some or all of these variables may be the key to identifying root causes behind exception reports. There's no shortage of variables.
The summary dashboard in Figure 3 shows the kind of runtime intelligence that can be generated in Visual Studio using Dotfuscator Community Edition. The data shows the real-world usage patterns of a CodePlex ALM application, Scrum Sprint Monitor. Developed independently and using Dotfuscator Community Edition for instrumentation, Scrum Sprint Monitor, according to the project page, "provides the Agile team with hands-off, always up-to-date status of the current Sprint, both at the individual and team level."
Figure 3 and Figure 4 show actual runtime intelligence generated for Scrum Sprint Monitor. Access to the application, its source and its runtime data is open through codeplex.com. These figures show application, feature and usage data that provide development with insight into user activity and preferences -- key insight for the product owner across the life of this application.
The application of runtime data can be further expanded by mashing it up with other relevant data. Feature-usage data, for instance, can be exported and integrated with code-coverage data to visually identify potential gaps between test plans and real-world usage patterns. The CodePlex integration cited in Figure 3 and Figure 4 is a good example.
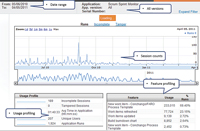
[Click on image for larger view.] |
| Figure 3. The Runtime Intelligence portal showing application and feature summary analytics using Dotfuscator Community Edition and the CodePlex Runtime Intelligence portal account. |
The CodePlex site utilizes the RESTful API to extract runtime data for CodePlex projects using runtime intelligence and surfaces that data inside the project portals. This approach provides the CodePlex community with a consistent user experience for both developers and users alike across all CodePlex projects.
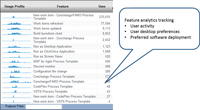
[Click on image for larger view.] |
| Figure 4. Feature-level analytics in the Runtime Intelligence portal. |
Analytics Scenarios
As valuable as application analytics can be, it's no panacea.
However, there are a number of scenarios where inclusion (or exclusion) should be a deliberate rather than a passive decision.
Beta Cycle
- Measuring feature usage, exception reports and performance profiling are typically the objectives of beta releases (obviously).
- End users are likely to opt-in, as they're typically already expected to provide feedback (it's a timesaver for them).
- The release itself is short, so the value of the runtime intelligence can be assessed -- for instance, did the runtime intelligence help improve software quality or design?
Refactoring, Migration and Modernization
- The ability to inject instrumentation post-compile can provide essential insight into how current production software is actually being used.
- Injection can also be used to measure SharePoint plug-ins and other software components that can be expensive to migrate when upgrading.
- Analytics can run across both existing surfaces (thin clients, on-premises servers) and target platforms (Windows Azure, Silverlight, Windows Phone 7).
Applications with High Volumes of Distributed Users
- Automation of opt-in policy enforcement simplifies broad deployment process.
- Selective feature tracking combined with user demographics can reveal trends not easily revealed through focus groups, surveys and so on.
Mobile Applications
There's an expanded version of Dotfuscator and Runtime Intelligence available to the Windows Phone 7 development community that includes all of the features typically found in the commercial SKU. Custom data can be used to:
- Better design trial and paid versions of marketplace applications.
- Respond more rapidly to user preferences and capture exceptions to improve ratings.
- Track ad placement effectiveness within an application.
Application Analytics and Lifecycle Management
Agile development methodology is built upon the principle that effective development can't succeed without effective communication. It recognizes that a significant and sustained investment on the part of the developer is required to achieve that goal. The Visual Studio ALM tools operationalize and standardize the application development lifecycle accordingly.
With the flexibility, extensibility and distributed capabilities of the Microsoft .NET Framework, your ability to model, monitor and replicate real-world scenarios will become increasingly difficult. Application analytics that capture real-world usage across physical network surfaces are emerging as a critical ingredient in the recipe for user-driven development.