Inside TFS
IntelliTrace Moves Beyond Development in Visual Studio 11
IntelliTrace can only be used in development environments in Visual Studio 2010 but that changes in the upcoming IDE. Learn how to use the new IntelliTrace in Production features in the Visual Studio 11 Developer Preview.
IntelliTrace is a debugging feature that allows you to capture application state information during execution. This means, if a bug is found, you can see details of the application execution, effectively eliminating the “no repro” bug scenario. The IntelliTrace log files enable you to “step back in time” during the program execution, to examine stack trace and event information, or to click on an exception and drill down directly to the buggy code. Introduced with Visual Studio 2010 Ultimate, IntelliTrace is a huge step forward in debugging applications.
Unfortunately, one of the major drawbacks to IntelliTrace is it can only be used in development environments, not in production. However, that changes in the next version of Visual Studio. With Visual Studio 11, use of IntelliTrace in a production setting is now supported.
Running IntelliTrace on the Production Server
As an example, let’s assume I have a production Web site that throws an error when a specific link is clicked. I’ve tried to recreate this error in the development environment, but have been unsuccessful. IntelliTrace in production allows me to collect extensive debug information, on the production application, while it is running, which I can then use to solve the problem.
The first step is to extract the IntelliTrace files onto the production server. All the IntelliTrace files are kept in a .CAB file named IntelliTraceCollection.cab. This file is found at c:\Program Files (x86)\Microsoft Visual Studio 11.0\Team Tools\TraceDebugger Tools. To extract the files, use a command prompt:
Expand IntelliTraceCollection.cab –F:*.* C:\IntelliTrace
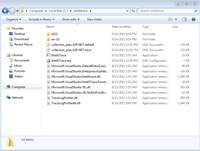
Otherwise, the file structure needed will not be maintained. Figure 1 shows a screenshot of the unpacked files.

[Click on image for larger view.] |
| Figure 1. IntelliTrace Files on the Production Server |
With the IntelliTrace files on the production server, the next step is to “turn on” IntelliTrace. To do that in production, I have to run a PowerShell script. Open a PowerShell window, and import the IntelliTrace code using the following command:
Import-Module c:\IntelliTrace\Microsoft.VisualStudio.IntelliTrace.PowerShell.dll
Once this DLL is imported, run Get-Help *IntelliTrace* to see a list of the available IntelliTrace commands, shown in Figure 2. I can use the Get-Help Start-IntelliTraceCollection method to retrieve detailed information on a specific command.

[Click on image for larger view.] |
| Figure 2. IntelliTrace PowerShell Commands |
Collecting Execution Information
To start collecting information on my Web application, I use the Start-IntelliTraceCollection command:
Start-IntelliTraceCollection “FabrikamFiber.Extranet.Web”
C:\IntelliTraceLogsc:\IntelliTrace\collection_plan.ASP.NET.trace.xml
This command requires the IIS application pool I want to monitor, a location to store the IntelliTrace .iTrace file, and the collection plan information. In the previous command, I am going to monitor the FabrikamFiber.Extranet.Web application pool, and store my IntelliTrace files in the c:\IntelliTraceLogs folder. Remember: the iTrace file can grow quickly and become very large, so make sure there is enough free space available for the file.
At this point IntelliTrace is enabled, running and collecting execution information for the application pool. If I want to know the current collection status, I can run the Get-IntelliTraceCollectionStatus method, shown in Figure 3.

[Click on image for larger view.] |
| Figure 3. IntelliTrace Collection Status Information |
When I’ve finished collecting the IntelliTrace information, I can stop the collection process using the following command:
Stop-IntelliTraceCollection<AppPoolName>
As a best practice, I shouldn’t leave IntelliTrace running any longer than necessary. However, if I need to look at the data captured so far, without stopping the collection process, I can use the Checkpoint-IntelliTraceCollection PowerShell command. This makes a copy of the .iTrace file at that particular point in time. I can then take the .iTrace file and analyze it in Visual Studio, while IntelliTrace continues to gather information.
Once I have the IntelliTrace log file from the production system, I can open it in Visual Studio for analysis. For more information, see Debugging Applications with IntelliTrace.
IntelliTrace in production provides yet another tool to allow developers to solve those hard-to-reproduce bugs, resulting in faster bug fixes and less time spent trying to reproduce bugs.
About the Author
Mickey Gousset spends his days as a principal consultant for Infront Consulting Group. Gousset is lead author of "Professional Application Lifecycle Management with Visual Studio 2012" (Wrox, 2012) and frequents the speaker circuit singing the praises of ALM and DevOps. He also blogs at ALM Rocks!. Gousset is one of the original Team System/ALM MVPs and has held the award since 2005.