Inside TFS
Use Code Maps to Understand Code Relationships
Visual Studio 2012 Update 1 (Ultimate Edition) includes a new tool to help visualize code relationships, and it's worth your time to learn.
Maintaining a large code base is hard. Diving in and understanding an unfamiliar code base is even harder. But every developer has had to do this at some point in his career. There are multiple approaches you can take, most of which usually end up with you using a piece of paper to diagram out relationships in your code.
Visual Studio 2012 provides an architecture tool to help with this: the dependency graph. With dependency graphs, you can easily create a visual representation of a project or solution, which you can drill into for details. Visual Studio 2012 Update 1 provides an even more user-friendly tool for creating and manipulating this type of visualization, called a code map.
Similar to dependency graphs, code maps allow you to visualize code relationships. When you create a new code map, it appears in a tab next to the code editor. This allows you to see where you are in the hierarchy of the code while you're working in the code itself.
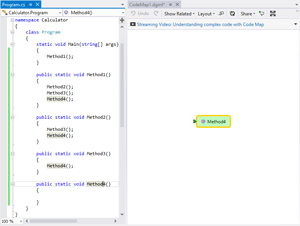
To get started with code maps, open your source code, right-click on a method name and select Show on Code Map. This opens a new tab, named CodeMap1.dgml, next to your code tab, and adds a single node to the tab as shown in Figure 1.
 [Click on image for larger view.]
Figure 1. Creating a new code map with one node for Method4.
Notice the green arrow next to the node. This indicates that your cursor is currently in this method. Select a different method in your code file, and the arrow next to your node will disappear. Select the method again, and the green arrow reappears next to the node.
Double-clicking a node on the code map takes you directly to that method. While the node is selected in the code map, all the places that method is called are also highlighted in the code file (you can see this in Figure 1). If you hover the mouse over a node, a pop-up window will show some detailed information about the node.
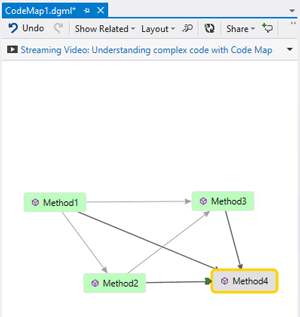
Let's say you want to find all the methods that call this method. You can right-click on the method and select Find All References. This will find all the references in your code that call this method, and add them as nodes on the graph as shown in Figure 2.
 [Click on image for larger view.]
Figure 2. The code map after running Find All References on Method4.
The latest nodes added to the diagram appear highlighted in green, making it easy to see changes that have occurred in the code map. Code maps can also get rather big, depending on the number of nodes you add. The toolbar at the top of the tab can be used to resize the diagram. It can also be used to change the diagram orientation.
Colors can be used on the diagram to make certain nodes stand out, or indicate actions that need to be taken on certain nodes. To change a node's color, right-click on a node and select Flag for Follow Up to turn the node red, or select Other Flag Colors and select the appropriate color.
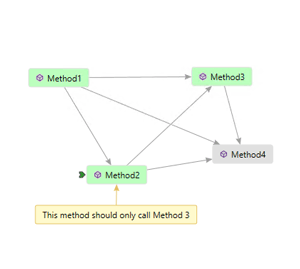
To provide more information or context, comments can be added to nodes on the code map. To add a comment to a node, right-click on the code and select New Comment. Double-click the comment to make it editable, then enter your comment. You can also drag the comment to a different area of the screen to organize the code map. Figure 3 shows a comment added to the Method2 node.
 [Click on image for larger view.]
Figure 3. A comment has been added to the Method2 node.
As you can imagine, it can be very helpful to share code maps you've created with other members of your team. You have several options for sharing your code map. At the top of the code map tab, on the toolbar, is a Share menu option. From here, you can create an XPS document and e-mail the code map as either an image or an XPS document. You can also move the code map into a Visual Studio project as a DGML file. Doing this allows you to then store the code map in Team Foundation Server (TFS) version control, making it easier for team members to access.
In order to create code maps, you must have Visual Studio 2012 Ultimate with Update 1 (also known as Visual Studio 2012.1 Ultimate) installed. Visual Studio 2012.1 Premium or Professional can be used to view code maps, make limited edits and navigate code using the code map.
Visualization is a proven way to understand concepts, and code maps can be a great way to visually understand and navigate complex projects.
About the Author
Mickey Gousset spends his days as a principal consultant for Infront Consulting Group. Gousset is lead author of "Professional Application Lifecycle Management with Visual Studio 2012" (Wrox, 2012) and frequents the speaker circuit singing the praises of ALM and DevOps. He also blogs at ALM Rocks!. Gousset is one of the original Team System/ALM MVPs and has held the award since 2005.