Code Focused
C++ Debugging in Visual Studio: Let's Start with the Basics
Debugging is a crucial part of the development process. In this new series of tried and true C++ tips, we look at the basics of debugging and step through some more advanced debuggings tips for C++ developers.
- By Bartlomiej Filipek
- 07/13/2016
We all know that debugging is an important part of software development process. Some might argue that it's best not to touch the debugger at all (and just write clean C++ code). The reality is that sooner or later you will encounter a situation where the debugger will save your code and/or career!
With the Visual Studio IDE you get one of the best-integrated debuggers for C++. For me, it's crucial to know how to use that tool efficiently. That's the aim here, and so I'd like to share a few tips and encourage you to search for even more advanced ways to use the debugger.
In the series, we'll cover:
- The basics of the Visual Studio IDE.
- How to change the version of the code at runtime (that way, you can test two or more solutions without recompiling).
- How to improve the logger so that you can quickly move to the message source.
- Conditional breakpoints
- How to control to which function the debugger can step into
And that's just for starters. We'll also look at how to get more information about objects while debugging, how to investigate lots of objects, mouse events, and debugging visualizers.
This time out, let's start fresh and look at the basics of the VS IDE. Things you should do to get familiar with the IDE:
- Learn the keyboard shortcuts! You should at least know the essential tasks like running the debugger, stepping in/out/over, continuing execution.
- Manage breakpoints: Do you know how to set breakpoints, or how to enable or disable breakpoints? Did you know you can even export breakpoints?
- Visual Studio 2015 offers a number of features for debugging. so why not use the latest version? Even if you still compile using VS 2013, you can open projects in VS2015, change the Platform Toolset to the version you need, and that way you're using the better debugger. Moreover, If you want to track performance or memory problems, it has a dedicated set of profiling tools.
- Start a debugging session (via the F5 key) and just wait until debugger stops on your breakpoints.
- Run the debugger to the cursor or pause the debugger to see what code is being executed at the moment. VS offers a way to break on various exceptions. There is a separate window (also improved in VS 2015) that you can control which exceptions will be handled.
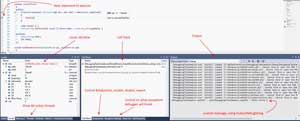
- When you hit a breakpoint you can observe the state of your application in various VS windows. Most notable are:
- Call Stack windows shows where you are in the code, what chain of methods was called up to the breakpoint.
- Autos and Locals window show current variables used in the app. What's more, Autos Window will also report the return value of the executed function.
- Threads Window shows the currently active Threads. You can also use Parallel Stacks Window.aspx to get an even better visualization of the state of threads.
- Output Window is one of the most useful windows: you can see your log messages here. All messages from OutputDebugString go there.
- From a breakpoint, you'll usually move line by line to see the code execution. You can step into a function or step over. There is also a method to set the next statement -- that way you can skip some part of the code or repeat the steps.
Figure 1 shows shows a basic debugger session.
 [Click on image for larger view.]
Figure 1: Basic Visual Studio Debugger
[Click on image for larger view.]
Figure 1: Basic Visual Studio Debugger
This short article was just a quick run through some of the basic tools in the VS debugger, so you probably skipped through most of it because you know all of it already.
Stay tuned and next time we'll tackle one technique I am especially keen on: how to improve logging to the output window so that you can quickly jump to the source code.
About the Author
Bartlomiej Filipek is a software developer in Poland who specializes in C++, Windows and graphics programming. He worked for a number of companies developing multimedia, document editors, games, graphics drivers and flight planning systems, and has taught game development at local university. Follow Bart's blog at http://www.bfilipek.com and on Twitter @fenbf.