Code Focused
Use Custom Visualizers for C++ Objects
Sometimes the default view of objects in the debugger isn't enough, especially if you operate on complex data structures. Here's one way to alter the view and use a customized one.
- By Bartlomiej Filipek
- 12/08/2016
In my article, "How Helper Variables Can Simplify Debugging," I mentioned that it might be handy to add special debug variables for the objects in your code. We can go further with this idea. For example, in Visual Studio you can write custom visualizers for your objects.
Before Visual Studio 2012 you could customize the debugging view of your objects by editing autoexp.dat file. It was a bit clumsy to use, though. Both the Automatic expansion of structures and avoid stepping into particular functions were configured using this file. Since VS 2012 we got a new framework called Natvis that uses XML to describe rules for debugging views.
For a simple example, for our SimpleParam structure shown here:
class SimpleParam
{
public:
    SimpleParam(const string& str, int val);

    void Init();
    string GetStrVal() const;

private:
    string mStr;
    int mVal;
};
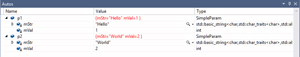
we get the view in the debugger shown in Figure 1.
 [Click on image for larger view.]
Figure 1: New Debugger View
[Click on image for larger view.]
Figure 1: New Debugger View
Not bad; we can easily see all the members. But with Natvis we can create a custom view of that.
In the code download accompanying this article is a file called NatvisFile.natvis. This is a configuration (stored per-project) that describes a custom visualizer. Here's what it looks like:
<AutoVisualizer xmlns = "...">
    <Type Name = "SimpleParam">
        <DisplayString>String: {mStr, sb}, Integer Value{ mVal }, StrLen{ strlen(&mStr[0]) }</DisplayString>
    <Expand>
        <Item Name = "String">mStr, sb< / Item>
        <Item Name = "Integer Value">mVal< / Item>
        </Expand>
    </Type>
</AutoVisualizer>
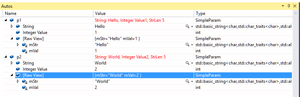
What it does is a simple alteration of the view, shown in Figure 2, that adds a custom description of the member fields and the string length information.
 [Click on image for larger view.]
Figure 2: Debugger View Customized with More Info
[Click on image for larger view.]
Figure 2: Debugger View Customized with More Info
Note that there's still the [Raw View] option that displays the default view.
You could do the following things with the framework:
- work on types, templates
- change names, select variables to be shown
- use expressions on variables (but not with side effects), some predefined Debugger intrinsic functions are available (like strlen)
- use conditional expressions to show more/less information
- show arrays, or even multi-dimensional arrays, linked lists structures
- add custom logic for traversing the structures
- set rules per project, or per system user or global (by setting a file in global directories)
If the file is attached to a project, then the debugger will dynamically reload it after resaving (even while debugging!). You can also enable diagnostics to see problems in the code. Check out the full documentation linked in the reference list below for even more features of the framework.
About the Author
Bartlomiej Filipek is a software developer in Poland who specializes in C++, Windows and graphics programming. He worked for a number of companies developing multimedia, document editors, games, graphics drivers and flight planning systems, and has taught game development at local university. Follow Bart's blog at http://www.bfilipek.com and on Twitter @fenbf.