News
Edge Browser Dev Tools for VS Code Now Generally Available
Microsoft has moved its Edge browser development tools for Visual Studio Code from preview to general availability, providing in-editor web site debugging and other functionality.
Because the company seeks to keep its popular open source, cross-platform code editor as lightweight as possible, the functionality comes in an extension.
The "Microsoft Edge Tools for VS Code" extension -- available from the editor's marketplace or via in-editor installation -- supports these features:
- Debug configurations for launching Microsoft Edge browser in remote-debugging mode and auto attaching the tools.
- Side Bar view for listing all the debuggable targets, including tabs, extensions, service workers, etc.
- Fully featured Elements and Network tool with views for HTML, CSS, accessibility and more.
- Screen-casting feature to allow you to see your page without leaving VS Code.
- Go directly to the line/column for source files in your workspace when clicking on a link or CSS rule inside the Elements tool.
- Auto attach the Microsoft Edge Tools when you start debugging with the Debugger for Microsoft Edge extension.
"The DevTools will connect to an instance of Microsoft Edge giving you the ability to see the runtime HTML structure, alter layout, fix styling issues, and view network requests. All without leaving VS Code," says the project's GitHub site.
The company earlier this month announced the general availability of the extension, bringing it out of the preview stage.
The idea is to provide easier tweaking of the look and feel of web projects at the same time the code is programmed.
"Continuously switching between editor and browser adds cognitive load to your workflow throughout the day," Microsoft said in a post earlier this month. "You change from one environment to another -- from development to debugging mode -- and you need to switch back. That feedback is what prompted us to explore embedding the developer tools into an extension, thus allowing you to see what your code generates and debug it without leaving your 'development' mindset."
New features of the GA release include:
-
New headless and full-browser modes: Launching the Microsoft Edge browser for debugging can be done by:
- Connecting to an existing running instance of Edge
- Launch a new instance navigated to your app
- Use a "headless" browser: This is an alternative to the "normal" mode in which a full browser window is provided for interaction, accessed with an extra browser icon in the task bar. In the headless mode, the browser doesn't pop up in a separate window but instead is embedded directly into VS Code.
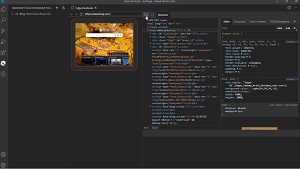 [Click on image for larger, animated GIF view.] New Headless Mode in Animated Action (source: Microsoft).
- A new Network pane: A new setting allows developers to enable a new Network tab for inspecting any network request of the attached browser. Network inspection -- which Microsoft said was the second-most-used feature in the Microsoft Edge DevTools -- was previously provided in a separate standalone extension. For now, it's disabled by default, though that could change.
- Easier contributions: Developers can now more easily contribute to the project after an architecture change. "In the past, you needed to download and build the whole of Chromium to contribute, now we only ask you to get the parts you need for the extension and wrote a few scripts to make the process easier." Contributing details are provided here.
The VS Code Marketplace says the Edge Tools extension has been installed 42,737 times as of this writing, earning an average 4.6 rating (scale to 5) from nine developer who reviewed it.
About the Author
David Ramel is an editor and writer at Converge 360.