News
Python in VS Code Adds Data Viewer for Debugging
The January 2021 update to the Python Extension for Visual Studio Code is out with a short list of new features headed by a data viewer used while debugging.
Python for VS Code comes with the
Python extension in the code editor's marketplace, which has been installed a whopping 30.3 million times, making it the most popular tool in the marketplace by far. It provides linting, debugging (multi-threaded, remote), Intellisense, Jupyter Notebooks, code formatting, refactoring, unit tests and more.
Updated monthly, its latest release closed 13 issues and includes an improvement to the Pylance language server and the new debugging data viewer.
"The data viewer in the Jupyter and Python extensions allow for easier and cleaner visualization of data when using Jupyter notebooks in VS Code," the dev team said. "We're excited to announce that in this release we added support for the data viewer when debugging Python files as well!
"To try it out, you will need to have pandas installed in the selected environment for your workspace. Then, you can just add a breakpoint after the line of the variable you want to inspect, hit F5 and select Python File from the configuration menu."
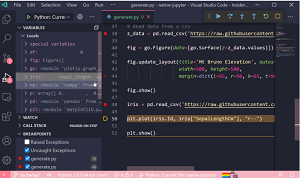 [Click on image for larger, animated GIF view.] The Debugging Data Viewer in Animated Action (source: Microsoft).
The release also provides PYTHONPATH support with Pylance, the language server introduced last summer to provide Python-specific "smarts" for IntelliSense and such.
"This release includes support to allow you to use the PYTHONPATH variable in .env files with Pylance for improved import resolution," Microsoft said. "If you're a Pylance user, your PYTHONPATH specified in .env files is now read alongside any paths included in python.analysis.extraPaths as an import root. In addition, editing the .env file will now update environment variables without any need for a reload."
A few more minor tweaks include:
- Integration with the bandit linter will highlight the variable, function or method for an issue instead of the entire line. Requires latest version of the bandit package to be installed. (thanks Anthony Shaw!) (#15003)
- Remove code snippets (you can copy the old snippets and use them as your own snippets). (#14781)
- Updated the logic for parsing and sending selected code to the REPL. (#14048)
More information on all of the above and many other items is available in the changelog.
About the Author
David Ramel is an editor and writer at Converge 360.