The Data Science Lab
DBSCAN Data Clustering from Scratch Using C#
Compared to other clustering techniques, DBSCAN does not require you to explicitly specify how many data clusters to use, explains Dr. James McCaffrey of Microsoft Research in this full-code, step-by-step machine language tutorial.
Data clustering is the process of grouping data items so that similar items are placed in the same cluster. There are several different clustering techniques, and each technique has many variations. Common clustering techniques include k-means, Gaussian mixture model, density-based and spectral. This article explains how to implement DBSCAN ("density based spatial clustering of applications with noise") clustering from scratch using the C# programming language. The acronym is slightly misleading because DBSCAN is not specific to database data.
Compared to other clustering techniques, DBSCAN does not require you to explicitly specify how many data clusters to use. Instead you specify an epsilon value and a min-points value that indirectly determine how many clusters to use to group the data items. Also, unlike most other clustering techniques, DBSCAN identifies outlier data items and assigns them to a special "noise" cluster. DBSCAN clustering is well-suited for both small datasets and large datasets, although the DBSCAN clustering process can be relatively slow for huge datasets.
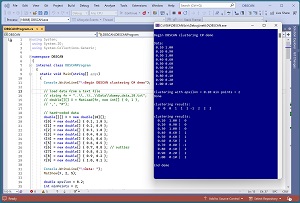 [Click on image for larger view.] Figure 1: DBSCAN Data Clustering in Action
A good way to see where this article is headed is to take a look at the screenshot of a demo program in Figure 1. For simplicity, the demo uses just N = 10 data items:
0.1, 1.0
0.2, 0.9
0.3, 1.0
0.4, 0.6
0.5, 0.6
0.6, 0.5
0.7, 0.8
0.8, 0.1
0.9, 0.2
1.0, 0.1
Each data item is a vector with dim = 2 elements. DBSCAN clustering is designed for strictly numeric data. After clustering with epsilon = 0.20 and min-points = 2, the resulting clustering is: (0, 0, 0, 1, 1, 1, -1, 2, 2, 2). This means data items [0], [1], [2] are assigned to cluster 0, items [3], [4], [5] are assigned to cluster 1, item [6] is assigned to the special noise cluster [-1], and items [7], [8], [9] are assigned to cluster 2.
This article assumes you have intermediate or better programming skill but doesn't assume you know anything about DBSCAN clustering. The demo is implemented using C#, but you should be able to refactor the demo code to another C-family language if you wish.
The complete source code for the demo program is presented in this article. The complete code is also available in the accompanying file download, and is also available online.
Understanding DBSCAN Clustering
DBSCAN clustering is quite simple and is probably best understood by looking at an example. The graph in Figure 2 shows the demo data. Suppose that you specify epsilon = 0.20 and min-points = 2. You start by picking the first unexamined data point, which is item [0] at (0.10, 1.00). Next, you find all the neighbor points that are less than a distance of epsilon = 0.20 from item [0]. There is just one neighbor that close, item [1] at (0.20, 0.90). You now have two points and form a cluster (with ID = 0) because you have at least min-points = 2 items. Next, you check each of the non-starting points, which in this case is just item [1], and look for its neighbors. You find item [2] at (0.30, 1.00) and add it to the current cluster.
At this point you don't find any additional close neighbors and start the next cluster (with ID = 1) with the first unexamined point, which is item [3] at (0.40, 0.60). That starting point would add items [4] and [5] to the cluster. The next unexamined point is item [6] at (0.70, 0.80). There are no neighbors within epsilon = 0.20 and so item [6] is added to the special noise cluster (ID = -1). The clustering process finishes by assigning items [7], [8], [9] to the last cluster (ID = 2).
[Click on image for larger view.] Figure 2: The Demo Data
When using DBSCAN clustering, you should normalize the data so that all the columns have roughly the same magnitude, often between 0 and 1, or between -1 and +1. This prevents a column with large magnitudes (such as employee annual incomes like $60,000) from dominating columns with small magnitudes (such as employee ages like 27). The most common data normalization techniques are divide-by-k, min-max and z-score.
The result of DBSCAN clustering depends entirely on the epsilon and min-points parameter values. These must be determined by experimentation. For example, for the demo data shown in Figure 2, if epsilon = 0.05 and min-points = 2 then all 10 data items would be assigned to noise, ID = -1. If epsilon = 0.50 and min-points = 2, then all 10 data items would be assigned to a single cluster, ID = 0.
Overall Program Structure
I used Visual Studio 2022 (Community Free Edition) for the demo program. I created a new C# console application and checked the "Place solution and project in the same directory" option. I specified .NET version 6.0. I named the project DBSCAN. I checked the "Do not use top-level statements" option to avoid the program entry point shortcut syntax.
The demo has no significant .NET dependencies, and any relatively recent version of Visual Studio with .NET (Core) or the older .NET Framework will work fine. You can also use the Visual Studio Code program if you like.
After the template code loaded into the editor, I right-clicked on file Program.cs in the Solution Explorer window and renamed the file to the slightly more descriptive DBSCANProgram.cs. I allowed Visual Studio to automatically rename class Program.
The overall program structure is presented in Listing 1. The DBSCANProgram class houses the Main() method, which has all the control logic, and has functions to load data from a text file into memory. The MyDBSCAN class houses all the clustering functionality.
Listing 1: Overall Program Structure
using System;
using System.IO;
using System.Collections.Generic;

namespace DBSCAN
{
  internal class DBSCANProgram
  {
    static void Main(string[] args)
    {
      Console.WriteLine("Begin DBSCAN clustering C# demo ");
      // 1. load data into memory
      // 2. create DBSCAN object
      // 3. cluster the data
      // 4. display the results
      Console.WriteLine("End demo ");
      Console.ReadLine();
    }

    static void MatShow(double[][] m, int dec,
      int wid) { . . }

    static void VecShow(int[] vec, int wid) { . . }

    static void VecShow(double[] vec, int dec, int wid,
      bool nl) { . . }

    public static void ListShow(List<int> list,
      int wid) { . . }

    static double[][] MatCreate(int rows, int cols) { . . }

    static int NumNonCommentLines(string fn,
      string comment) { . . }

    static double[][] MatLoad(string fn, int[] usecols,
      char sep, string comment) { . . }

  } // Program

  // --------------------------------------------------------

  public class MyDBSCAN
  {
    public double eps;
    public int minPts;
    public double[][] data;  // supplied in cluster()
    public int[] labels;  // supplied in cluster()

    public MyDBSCAN(double eps, int minPts) { . . }

    public int[] Cluster(double[][] data) { . . }

    private List<int> RegionQuery(int p) { . . }

    private void Expand(int p, List<int> neighbors,
      int cid) { . . }

    private static double EucDistance(double[] x1,
      double[] x2) { . . }
  }
} // ns
The Cluster() method does all the work but calls helper method RegionQuery() to fetch neighbor points and helper Expand() to grow a cluster by adding neighbor points. Helper function EucDistance() returns the Euclidean distance between two points/vectors and is used by the RegionQuery() method.
Loading the Data
The demo program begins by loading the dummy data into memory:
double[][] X = new double[10][];
X[0] = new double[] { 0.1, 1.0 };
X[1] = new double[] { 0.2, 0.9 };
X[2] = new double[] { 0.3, 1.0 };
X[3] = new double[] { 0.4, 0.6 };
X[4] = new double[] { 0.5, 0.6 };
X[5] = new double[] { 0.6, 0.5 };
X[6] = new double[] { 0.7, 0.8 }; // outlier
X[7] = new double[] { 0.8, 0.1 };
X[8] = new double[] { 0.9, 0.2 };
X[9] = new double[] { 1.0, 0.1 };
For simplicity, the data is hard-coded. In a non-demo scenario, you'll probably want to read the data from a text file into memory using the helper MatLoad() method like so:
string fn = "..\\..\\..\\Data\\dummy_data_10.txt";
double[][] X = MatLoad(fn, new int[] { 0, 1 },
 ',', "#");
The parameters mean to use columns 0 and 1 of the text file, which is comma-delimited, and where the "#" character at the start of a line indicates a comment.
The demo program displays the loaded data using the MatShow() function:
Console.WriteLine("Data: ");
MatShow(X, 2, 5);  // 2 decimals, 5 wide
In a non-demo scenario, you might want to display all the data to make sure it was loaded properly.
Clustering the Data
The DBSCAN clustering object is created and used like so:
double epsilon = 0.20;
int minPoints = 2;
Console.WriteLine("Clustering with epsilon = " +
  epsilon.ToString("F2") + " min points = " +
  minPoints);
MyDBSCAN dbscan = new MyDBSCAN(epsilon, minPoints);
int[] clustering = dbscan.Cluster(X);
Console.WriteLine("Done ");
As mentioned, the results of DBSCAN clustering, including the number of clusters produced, depend entirely on the values of epsilon (minimum distance between two data items) and min-points (the smallest number of close neighbors required to form a cluster). These parameter values must be determined by trial and error.
Displaying the Clustering Results
The demo concludes by displaying the clustering results:
Console.WriteLine("clustering results: ");
VecShow(clustering, 3);

Console.WriteLine("clustering results: ");
for (int i = 0; i < X.Length; ++i)
{
  for (int j = 0; j < X[i].Length; ++j)
    Console.Write(X[i][j].ToString("F2").PadLeft(6));
  Console.Write(" | ");
  Console.WriteLine(clustering[i].ToString().PadLeft(2));
}
The results look like:
0  0  0  1  1  1 -1  2  2  2

0.10  1.00 |  0
0.20  0.90 |  0
0.30  1.00 |  0
0.40  0.60 |  1
. . .
The clustering information can be displayed in several ways. For example, instead of displaying by data item, you can display by cluster ID:
for (int cid = -1; cid < 3; ++cid) {
  Console.WriteLine("cid = " + cid);
  for (int i = 0; i < X.Length; ++i) {
    if (clustering[i] == cid) {
      for (int j = 0; j < X[i].Length; ++j)
        Console.Write(X[i][j].ToString("F2").PadLeft(6));
      Console.WriteLine();
    }
  }
}
The output would look like:
cid = -1
  0.70  0.80

cid = 0
  0.10  1.00
  0.20  0.90
  0.30  1.00

cid = 1
  0.40  0.60
. . .
The DBSCAN Class Constructor
The class members and constructor method are:
public class MyDBSCAN
{
  public double eps;
  public int minPts;
  public double[][] data;  // supplied in cluster()
  public int[] labels;  // supplied in cluster()

  public MyDBSCAN(double eps, int minPts)
  {
    this.eps = eps;
    this.minPts = minPts;
  }
. . .
It's common to call the array that holds the cluster IDs "labels" rather than the slightly more descriptive "clustering." The data to be clustered has to be stored at some point. The demo design stores the data in the Cluster() method. An alternative design is to pass the data to be clustered to the MyDBSCAN constructor.
The Clustering Methods
The clustering functionality is performed by method Cluster(), which calls methods RegionQuery() and Expand(). The RegionQuery() method calls the helper EucDistance() function. The code is presented in Listing 2.
Listing 2: The Core Clustering Methods
public int[] Cluster(double[][] data)
{
  this.data = data;  // by reference
  this.labels = new int[this.data.Length];
  for (int i = 0; i < labels.Length; ++i)
    this.labels[i] = -2;  // unprocessed

  int cid = -1;  // offset the start
  for (int i = 0; i < this.data.Length; ++i)
  {
    if (this.labels[i] != -2)  // has been processed
      continue;

    List<int> neighbors = this. RegionQuery(i);
    if (neighbors.Count < this.minPts)
    {
      this.labels[i] = -1;  // noise
    }
    else
    {
      ++cid;
      this.Expand(i, neighbors, cid);
    }
  }

  return this.labels;
}

private List<int> RegionQuery(int p)
{
  List<int> result = new List<int>();
  for (int i = 0; i < this.data.Length; ++i)
  {
    double dist = EucDistance(this.data[p], this.data[i]);
    if (dist < this.eps)
      result.Add(i);
  }
  return result;
}

private void Expand(int p, List<int> neighbors, int cid)
{
  this.labels[p] = cid;
  for (int i = 0; i < neighbors.Count; ++i)
  {
    int pn = neighbors[i];
    if (this.labels[pn] == -1)  // noise
      this.labels[pn] = cid;
    else if (this.labels[pn] == -2)  // unprocessed
    {
      this.labels[pn] = cid;
      List<int> newNeighbors = this. RegionQuery(pn);
      if (newNeighbors.Count >= this.minPts)
        neighbors.AddRange(newNeighbors); // modifies loop
     }
  }
}

private static double EucDistance(double[] x1,
  double[] x2)
{
  int dim = x1.Length;
  double sum = 0.0;
  for (int i = 0; i < dim; ++i)
    sum += (x1[i] - x2[i]) * (x1[i] - x2[i]);
  return Math.Sqrt(sum);
}
The demo program uses -2 to indicate a data item that has not yet been processed. An alternative design is to maintain a Boolean array with a name like "visited."
The RegionQuery() method returns neighbor data items that are a distance strictly less than the epsilon value. I used the name RegionQuery instead of something more logical like "GetNeighbors" because RegionQuery is used in the 1996 original research paper "A Density-Based Algorithm for Discovering Clusters in Large Spatial Databases with Noise" by M. Ester, et al. The RegionQuery() method uses a strictly less-than epsilon condition. Some DBSCAN implementations use a less-than-or-equal condition.
The Cluster() method stores the data to be clustered by reference rather than by value. An alternative is to make an explicit copy of the data in situations where the data might be modified by some other external process.
The demo program uses Euclidean distance to determine if data items are neighbors. There are other distance measures, such as Manhattan distance or Minkowski distance, but as far as I know there are no research results that suggest an alternative to Euclidean distance is useful.
Utility Functions
The top-level Program class defines six helper functions. The code is presented in Listing 3. The MatShow() and VecShow() functions are used to display the data and the resulting clustering array. The ListShow() function is not used by the demo but is handy if you want to insert code to programmatically examine the neighbors because they're defined as a List<int> collection.
Listing 3: Utility Functions
static void MatShow(double[][] m, int dec, int wid)
{
  for (int i = 0; i < m.Length; ++i)
  {
    for (int j = 0; j < m[0].Length; ++j)
    {
      double v = m[i][j];
      if (Math.Abs(v) < 1.0e-5) v = 0.0;  // avoid "-0.0"
      Console.Write(v.ToString("F" + dec).PadLeft(wid));
    }
    Console.WriteLine("");
  }
}

static void VecShow(int[] vec, int wid)
{
  for (int i = 0; i < vec.Length; ++i)
    Console.Write(vec[i].ToString().PadLeft(wid));
  Console.WriteLine("");
}

public static void ListShow(List<int> list, int wid)
{
  for (int i = 0; i < list.Count; ++i)
    Console.Write(list[i].ToString().PadLeft(wid));
  Console.WriteLine("");
}

static double[][] MatCreate(int rows, int cols)
{
  double[][] result = new double[rows][];
  for (int i = 0; i < rows; ++i)
    result[i] = new double[cols];
  return result;
}

static int NumNonCommentLines(string fn,
  string comment)
{
  int ct = 0;
  string line = "";
  FileStream ifs = new FileStream(fn, FileMode.Open);
  StreamReader sr = new StreamReader(ifs);
  while ((line = sr.ReadLine()) != null)
    if (line.StartsWith(comment) == false)
      ++ct;
  sr.Close(); ifs.Close();
  return ct;
}

static double[][] MatLoad(string fn, int[] usecols,
  char sep, string comment)
{
  // count number of non-comment lines
  int nRows = NumNonCommentLines(fn, comment);

  int nCols = usecols.Length;
  double[][] result = MatCreate(nRows, nCols);
  string line = "";
  string[] tokens = null;
  FileStream ifs = new FileStream(fn, FileMode.Open);
  StreamReader sr = new StreamReader(ifs);

  int i = 0;
  while ((line = sr.ReadLine()) != null)
  {
    if (line.StartsWith(comment) == true)
      continue;
    tokens = line.Split(sep);
    for (int j = 0; j < nCols; ++j)
    {
      int k = usecols[j];  // into tokens
      result[i][j] = double.Parse(tokens[k]);
    }
    ++i;
  }
  sr.Close(); ifs.Close();
  return result;
}
The MatLoad() function can be used to load data from a text file into an array-of-arrays style matrix. The design of MatLoad() mimics the Python NumPy library loadtxt() function. The MatLoad() function calls helper MatCreate() and helper NumNonCommentLines() functions. You might want to consider placing the MatCreate() and NumNonCommentLines() functionality directly in the MatLoad() function.
Wrapping Up
The DBSCAN clustering technique often gives very different results than the k-means clustering technique. This happens because DBSCAN can chain together neighbor data items, which can result in the first and last data items in a cluster being far apart. Because DBSCAN and k-means clustering can give significantly different results, it's not a bad idea to use both techniques.
Data clustering is an exploratory process. There is no correct clustering of any dataset. In most data clustering scenarios, there should be a human-in-the-loop where human expertise is used to examine clustering results to see if there are any interesting patterns.