Q&A
Geographically Visualizing Customer Data with Blazor and ArcGIS
Developers, always seeking new techniques to enhance their applications and provide meaningful insights to users, might want to consider the power of geographically visualizing data. As businesses increasingly rely on location-based data to make strategic decisions, the ability to visualize this information in a meaningful and accessible way has become crucial.
Geospatial data adds context to applications. Imagine being able to overlay customer data on a map, instantly revealing patterns, clusters and relationships. Whether you're analyzing sales territories, monitoring environmental changes, or tracking the spread of diseases, geospatial visualization provides a holistic view that goes beyond mere numbers.
Enter the innovative combination of Blazor and ArcGIS -- a game-changer in the realm of application development. Blazor, with its promise of using .NET in browser applications through WebAssembly, offers a seamless way for .NET developers to build interactive web applications. When paired with ArcGIS, a leading platform in geospatial analysis and mapping, it unlocks a new dimension of data visualization capabilities.
To help leverage this game-changing technology in .NET apps, there is no more authoritative source than Tim Purdum, engineering manager and senior software engineer at dymaptic.
A full-stack .NET and Blazor specialist, he is the creator of the GeoBlazor open-source .NET library that integrates Blazor/ArcGIS tech. He is going to share his expertise on the technique and the tool in an upcoming session titled "Geographically Visualizing Customer Data with Blazor and ArcGIS" at the Visual Studio Live! developer conference in Chicago, which starts April 29.
We caught up with Purdum to learn more about his upcoming session in a short Q&A.
VisualStudioMagazine: What inspired you to present a session on this topic?
Purdum: Every day I work with Blazor and ArcGIS for a variety of public and private-sector customers. Two years ago, while learning about ArcGIS, I was inspired to "bridge" these two technologies together and have been building an open-source solution called GeoBlazor ever since.
What is ArcGIS and how does it help developers visualize location-based data?
ArcGIS is a Geospatial Information System (GIS) data analysis and visualization tool.
 "ArcGIS is a Geospatial Information System (GIS) data analysis and visualization tool. The core functions for visualizing data are 2D maps and 3D scenes, where you can overlay custom data points on top of terrain, roads, or any other map data."
Tim Purdum, Engineering Manager and Senior Software Engineer, dymaptic
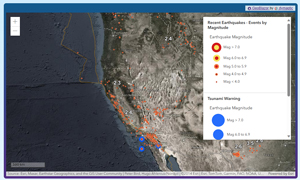
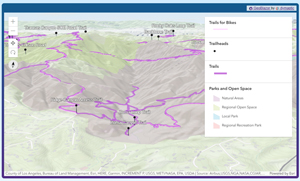
The core functions for visualizing data are 2D maps and 3D scenes, where you can overlay custom data points on top of terrain, roads, or any other map data. Your location-based data can be loaded from any data source, as well as hosted in ArcGIS Online.
 [Click on image for larger view.]
 [Click on image for larger view.]
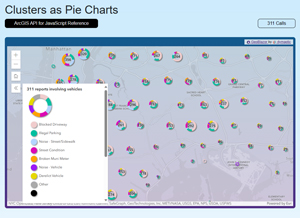
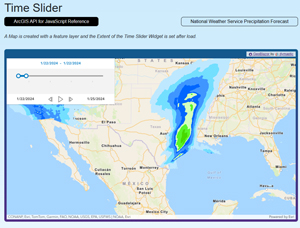
ArcGIS also supports data clustering, binning, filtering, chart visualizations and even animations of data over time.
 [Click on image for larger view.]
 [Click on image for larger view.]
What are some common challenges with adding interactive maps to a Blazor application?
The biggest hurdle to adding maps to Blazor applications is the fact that most web mapping solutions, including ArcGIS, target JavaScript as the default language for interaction. While calling into JavaScript from Blazor is fairly straightforward, it requires some mental overhead to switch languages and frameworks whenever you want to interact with the map. GeoBlazor helps bridge this gap, and allows .NET developers to stay in C# and Razor while building interactive maps.
What are the benefits of using interactive maps in a Blazor application?
Using interactive maps give end users the chance to visualize their data in new ways, tracking everything from shipments to outages. Layered maps as a centerpoint of an online dashboard allows administrators to quickly assess the current situation.
What are GeoBlazor widgets, and how can they be used to enhance the user experience when exploring geospatial data in a Blazor application?
GeoBlazor includes numerous widgets, providing functionality such as zoom to location, bookmarking views, turning on or off data layers, selecting basemaps from a gallery, displaying legend information or scale. The GeoBlazor Pro package also includes interactive widgets for drawing shapes, swiping between layers, and tracking changes over time. You can explore many of the GeoBlazor widgets here.
Is it easy for developers to layer their own custom data points over ArcGIS Living Atlas layers?
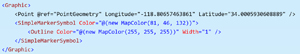
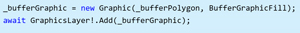
Yes! Custom points can be added either in Razor markup, or in C# code. All you need is a Latitude and Longitude to get started. Then you can select a base color, outline color, and widths, or even choose to display a custom icon for your point!
 [Click on image for larger view.]
 [Click on image for larger view.]
Looking ahead, what future developments do you anticipate in the field of geospatial data visualization, especially in the context of web applications using technologies like Blazor and ArcGIS?
I think the interactivity of GIS data is going to be central, and especially the projection of such data into 3-dimensional scenes. Already, ArcGIS supports integrations with Unity and Unreal game engines and the Cesium 3D mapping engine. I believe that 3D navigational experiences (web, virtual, augmented) combined with GIS data will be a powerful tool for both work and play in the near future.
Note: Those wishing to attend the conference can save hundreds of dollars by registering early, according to the event's pricing page. "Register for VSLive! Chicago by the March 8 Extended Super Early Bird deadline to save up to $400 and secure your seat for intensive developer training in Chicago!" said the organizer of the developer conference, which is being presented by the parent company of Visual Studio Magazine.
About the Author
David Ramel is an editor and writer at Converge 360.