Inside VSTS
Unit Testing with VSTS2008 (Part 2)
Mickey shows some other unit testing options, and how to enable code coverage, in Visual Studio Team System 2008
In Part 1 of this series we learned about unit testing in Visual Studio Team System 2008, and how it can be used to help developers write better quality code. We covered the basics of unit testing, how to use the unit test wizard to stub out unit test code, how to modify the code to make it a valid unit test, and how to run and view the results of a successful unit test.
In this column, we are going to build off what was done in the previous column. We will intentionally make the unit test fail to show what a failed test looks like. We will cover some of the other test options available in the unit test framework. Finally, we will look at how to enable and view code coverage for unit tests.
A Failing Unit Test
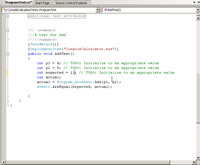
Using the AddTest() method described last week, change the expected result to be 11 (See Figure 1). Obviously, four plus five does not equal eleven, so the Assert.AreEqual() method will fail when the test is run, causing the unit test to fail.
[Click on image for larger view.] |
| Figure 1. A Failing Unit Test |
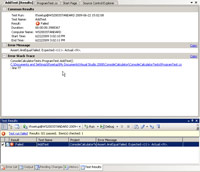
Save the changes, then right-click on the AddTest() method and select Run Tests from the context menu. The test will fail. In the Test Results window (shown in Figure 2), the failed test will be marked with a red X, giving a strong visual indicator of which test failed. Double-click the failed test to open the test results. This tab shows details about the test, including when the test was executed, the error message associated with the failed test, and a stack trace to help find the problems in the code. Use this information to find the code error and resolve it.
[Click on image for larger view.] |
| Figure 2. The Test Results window |
Other Unit Test Options
There are four additional test methods created by the wizard by default. These methods can be used to help initialize the application or clean up the application after tests have run.
The first set of methods are the MyTestInitialize() and MyTestCleanup(). This methods are marked with the TestInitialize() and TestCleanup() attributes, respectively. The MyTestInitialize() method is executed before each test method is executed, and the MyTestCleanup() method is executed after each test method is executed. So, if ten test are being run together, before each test runs, the MyTestInitialize() method will run, and after each test finishes, the MyTestCleanup() method will run. This is very useful if there is initialization or cleanup code that needs to run before and after each test.
The MyClassInitialize() and MyClassCleanup() methods are very similar to the above methods. They are marked with the ClassInitialize() and ClassCleanup() attributes, respectively. The main difference between them is the MyClassInitialize() method runs before the first test in the class runs, and the MyClassCleanup() method runs after the last test in the class completes. This is useful if there is code that needs to initialize the environment once before any unit tests run, and then needs to clean up the environment after all the tests have completed.
Code Coverage
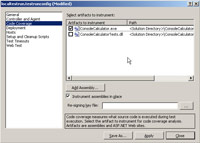
A nice feature to go along with unit testing in Team System is code coverage, which shows how much of the code has been tested by unit tests. Code coverage is turned off by default. To turn on code coverage, double-click the localtestrun.testrunconfig file in Solution Explorer. This will open the localtestrun.testconfig options window, shown in Figure 3.
[Click on image for larger view.] |
| Figure 3. Configuring Code Coverage |
Select Code Coverage in the list in the left of the window. There will be a checkbox list of all the different artifacts that can be instrumented displayed to the right. Check the box next to ConsoleCalculator.exe, as that is the code we want to test. Click the Apply button, then click the Close button to close the window. Code coverage has now been enabled for the console calculator code.
Now that code coverage is enabled, we want to run our tests to gather the code coverage information. As before, right-click on the AddTest() method and select Run Tests from the context menu. This will run the test as shown previously. Now, however, right-click on the test in the Test Results window, and select Code Coverage Results from the context menu. This will open the Code Coverage Results window, which will show, via percentages, how much code was tested with the unit tests, and how much code was untested. This window allows you to drill down to specific methods, to see what was tested and what was not tested. A percentage is given, down to the method level, of how much of the code was tested.
Double-click a specific method from the Code Coverage Results window to view that method. The code will be color-coded to give a visual indication of what code has been tested, and what code has not been tested. Lines of code colored blue indicate code that was tested, while lines of code colored red indicate code that has not been tested. This visual indication helps unit test authors quickly see what new tests need to be written to ensure a higher code coverage rate.
Conclusion
In this column, we have looked at what failed unit test looks like in Team System, some of the test options available, and how to enable and use code coverage. In our next and final installment of the series, we will look at how we can take our AddTest() method and make it data-driven.
About the Author
Mickey Gousset spends his days as a principal consultant for Infront Consulting Group. Gousset is lead author of "Professional Application Lifecycle Management with Visual Studio 2012" (Wrox, 2012) and frequents the speaker circuit singing the praises of ALM and DevOps. He also blogs at ALM Rocks!. Gousset is one of the original Team System/ALM MVPs and has held the award since 2005.