Inside TFS
TFS 2010 Reporting Using Microsoft Excel – Part 2
In the second part of this two-part series, Mickey Gousset shows how TFS 2010 lets users create Excel reports, including pivot tables and charts, from a work item query. The report can then be published and shared with other users.
In Part 1 of our series on reporting in Team Foundation Server (TFS) 2010 using Microsoft Excel, we talked about using Microsoft Excel to connect to the TFS OLAP cube to create Pivot Tables and Pivot charts. This process, while easy to do, does require several steps, and some knowledge of the TFS data warehouse, in order to create effective and useful reports.
One of the new reporting features in TFS 2010 is the ability to create a report based off a work item query. Since TFS 2005, you have had the ability to open work item queries in Microsoft Excel, allowing the user to view the query results in Excel, as well as make changes and push those changes back to TFS. TFS 2010 expands on this, giving users the ability to create actual excel reports, included pivot tables and charts, from a work item query. The report can then be taken and published, to share the report with other users.
Microsoft Excel Reports Using Work Item Queries
To show this functionality, I created a new query in my team project called All Non-Closed Tasks. This query displays all the tasks in my team project that are in a non-closed state. Figure 1 shows the results of that query when it is run in Team Explorer.
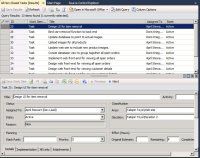
[Click on image for larger view.] |
| Figure 1. Query Results for the All Non-Closed Tasks query. |
To turn this query into an Excel report, you can select Open in Microsoft Office | Create Report in Microsoft Excel from the query results window toolbar. You can also right-click on the work item query in Team Explorer and select Create Report in Microsoft Excel.
Both options will open Microsoft Excel and the New Work Item Report window, shown in Figure 2. The report options displayed are based on the columns included in the work item query. There are two report sections, Current Reports and Trend Reports. Click the Finish button to generate the reports.
The first tab of the Excel Spreadsheet contains a table of contents of all the reports in the Excel spreadsheet, with hyperlinks to make it easy to quickly navigate to a specific report. Each tab contains a report, consisting of a Pivot Table and Pivot Chart. Figure 3 shows an example of the Assigned To Work Item Count Current Report.
Once the report has been generated, the pivot table associated with each tab can then be modified. These reports do not communicate back to TFS, so any changes made to a report does not make a change to the underlying work item query in TFS. This allows the user to make adjustments to the report, such as changing the chart type, and modifying colors to make the report easier to understand. It also allows the user to add more fields to the report, to make it more complete.
Excel reports, created either manually or using the work item query method outlined above, can be shared with other users via publishing the report. Options for publishing the Microsoft Excel report will depend on whether you are running Windows SharePoint Services or Microsoft Office SharePoint Server for the team project portal.
If you are using WSS, then you can publish the report to your document library. First, save the report to your local machine. Next, in Team Explorer, create a new folder or select an existing folder where the report will reside. Right-click on that folder and select Upload Document. Select the Excel report saved earlier and click Open. This report now appears in Team Explorer (Figure 4) and can be accessed by the team. Since the report is dynamically generated, every time it is opened it will display the latest information from TFS for the query on which it is based.
If you are running your team project portal on MOSS, then you have access to Excel Services, which makes it easy to publish the entire workbook or specific charts. Simply select the Microsoft Office button, followed by Publish | Excel Services. You can then add an Excel Web Access web part to your portal site to display the report you just published.
As the past two columns have shown, Microsoft Excel greatly increases the reporting options available to end users. Excel allows users to create reports containing the information they are concerned with, using a tool with which they are comfortable.
About the Author
Mickey Gousset spends his days as a principal consultant for Infront Consulting Group. Gousset is lead author of "Professional Application Lifecycle Management with Visual Studio 2012" (Wrox, 2012) and frequents the speaker circuit singing the praises of ALM and DevOps. He also blogs at ALM Rocks!. Gousset is one of the original Team System/ALM MVPs and has held the award since 2005.