In-Depth
Azure Performance Tips, Part 1: Prepping and Testing the Local Development Machine
In this multi-part series, Joseph Fultz will walk you through exactly what you need to know to make sure your Azure deployment performs optimally. First up, the steps you need to take on your local development machine.
- By Joseph Fultz
- 04/11/2012
Due to the pain I experienced during the dot-com boom, performance is something that's always on my mind. For whatever reason, when I'm looking at code in any layer I worry about performance at scale. I often worry most about the things that should be just fine, because under extreme stress those parts of a solution tend to behave differently than expected -- not unlike their human counterparts.
In this series I'm going to go through the things I check and the way I check them in an attempt to assure good performance in a Windows Azure deployment. My focus won't be on covering the full optimization of each layer, but rather the way I check locally and then translate into the cloud to check the performance in deployment. Note that I consider this effort less than full testing, but the goal here is to ensure a solid product leaving the development team and arriving fully ready for the test assault. In this installment my focus is on the local development machine, while subsequent articles will focus more on the cloud side of the performance check.
The Application
The first activity in testing the application is understanding how it's constructed and how it operates. To that end I've created a rather simple application that consists of a service layer in front of a 5GB database in both my local SQL Server Developer Edition and in SQL Azure. While there are a lot of rows, they're not very wide and the schema isn't particularly complex (see Figure 1).
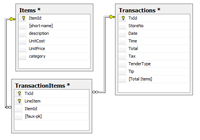
[Click on image for larger view.] |
| Figure 1. The SQL Server database schema. |
What I've done within this database is leave off any indexes that might benefit me for the purpose of finding them along the way. The service interface against which I'll be doing my initial testing is shown in Listing 1.
Obviously this isn't a complete interface, but it will do for my purposes here. In each function I'll use LINQ to allow it to generate the SQL to fetch the data. Between my length of data, lack of indexes, lack of prepared statements and lack of optimizing data types -- especially as they relate to crossing boundaries -- I should have plenty of chances to make these bits of code better.
Test Approach and Concepts
I'll take a top-down approach, testing from the primary interface through to the back-end. For a full test, I suggest the layers and components be tested more granularly/individually and then within a full integration. But right now, I'm mainly focused on some aspects of performance testing. Generally, as a developer working on a feature, you have a pretty good idea of the performance of a piece of code in isolation and under low stress. In fact, you might have some standards around performance for checking. However, I want to do a little more than just test in isolation. For some of you, this will require a special environment to which you can deploy code and get a more realistic test, but in many cases you can run a small but integrated test right from your machine to spot check it. This is what I want to do to have the confidence that the code I'm checking in and passing on to the test team has a good chance of performing well.
Visual Studio has full testing capabilities that I'll use locally prior to pushing my solution to the cloud. Then I'll cover running the tests in the cloud against the Staging deployment slot. One of the keys to identifying and making adjustments is to have an idea of the types of things you're looking for in each layer, as well as in the spaces between.
Figure 2 illustrates the various levels of detail that I spot-check and drill into if needed when I'm checking my work in my dev environment. Visual Studio provides most of the testing tools I need by providing functionality for Unit Testing, Load Testing, test metrics collection and performance counter collection. In addition, I'll use SQL Server Query Profiler to take a look at execution plans in SQL Server. Using these together in addition to some SQL Server built-in reports, I should be able to get a deployment that I can fine-tune for the cloud environment once there.
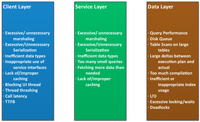
[Click on image for larger view.] |
| Figure 2. The various levels and layers to spot-check while testing your work in your dev environment. |
Setting up the Test Harness
While I've been doing a little more REST than SOAP for services lately, for this pass I'll work with the SOAP interfaces within the test project while also using the Windows Communication Foundation Test Client (WcfTestClient.exe).
With my service project set as the default project, I press Ctrl+F5 to start without debugging. Once the tools have the Windows Azure emulator running and my package is deployed, I add a reference to the running project so I can use the generated proxies to code my tests against (see Figure 3).
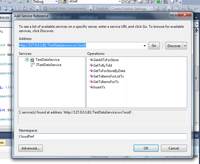
[Click on image for larger view.] |
| Figure 3. Adding a reference to the test project. |
The only thing left to do is to write a couple of tests and run them to see what the initial results might be. I'll run the tests one at a time, make any obvious adjustments, re-run the tests and repeat these steps until the obvious items are all resolved. Before I run a load test I'll simply run the unit tests in the current context and have both Perfmon and SQL Server Profiler running. Note, when I switch to running a load test in Visual Studio, I'll use Visual Studio to capture all performance counters. For now, I just want the lowest hanging fruit in the Web service and database execution.
The two tests I'm going to run first are GetTxById and GetTxForStoreByDate. I suspect that I have a couple of ways to optimize these prior to running, but putting first things first, I run the test to find that GetTxForStoreByDate fails. Upon the most minimal inspection I find that it times out. I can also see that the GetTxById result appears somewhat decent -- especially because it navigated 20 million rows (see Figure 4).
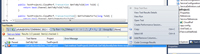
[Click on image for larger view.] |
| Figure 4. GetTxById and GetTxForStoreByDate test run results. |
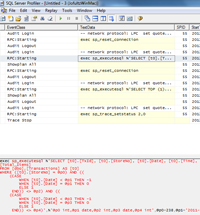
Note that on the context menu I can create the load test I'll need. I also have SQL Server Profiler running just to see the results of the execution plan (see Figure 5). A quick inspection of the query plan nets a Clustered Index Seek for the get by TxId.
[Click on image for larger view.] |
| Figure 5. SQL Server Profiler. |
Being fairly familiar with the app and the database schema, I understand why it's slow and take a look at the query plan for the query. I only see an index scan for the StoreNo, but nothing for the Date filter. I could pass my query to the SQL Server Tuning Wizard, but I prefer to hold off on that for a bit. Instead, I'm going to swag at adding an index for the date comparison. I get a positive result with SQL Server Profiler, now showing an Index Seek for the StoreNo and an Index Scan for the Date. Additionally, Visual Studio reports that my service returned in 10.5 seconds. That's pretty bad as a consumable interface, but potentially not in context. I have one other piece of information and that's that I returned 377 records from SQL Server in less than 2 seconds; I'm returning too many records and spending time doing serialization and transport. I'll need to adjust this and add some pagination to it to make it more appropriate for a high-performance Web service.
Cloud Data Baseline Test
At about the same time I've established what I might expect for performance locally, I like to get a rough idea of what I might be doing in the cloud. This isn't the point where I move the full test harness up; instead, I just change my connection string to point to my SQL Azure instance and give it a quick run to see the relative performance.
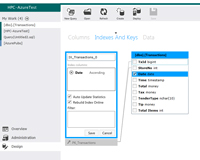
Before I run that test I'd like to go ahead and apply the lacking index I found on my local instance. Logging in to the management console for SQL Azure presents a nice Metro-style UI. Figure 6 shows me adding the index I created for the local run. Of course, I could script this, but the UI tools are nice to use and worth seeing.
[Click on image for larger view.] |
| Figure 6. Adding an index using the Metro–style UI in SQL Azure. |
Until Next Time
In this article I established application and unit tests with some numbers against a local SQL Server and the development fabric. Additionally, I touched on some of the things I want to check as the tests are run.
In the next installment, I'll migrate my testing to a load test and then deploy and test in the cloud. I'll take a look at what tools I have at my disposal to collect and comb through the execution and performance data, plus make appropriate changes for performance.
About the Author
Joseph Fultz is a cloud solution architect at Microsoft. He works with Microsoft customers developing architectures for solving business problems leveraging Microsoft Azure. Formerly, Fultz was responsible for the development and architecture of GM's car-sharing program (mavendrive.com). Contact him on Twitter: @JosephRFultz or via e-mail at [email protected].