In-Depth
Azure Performance Tips, Part 2: Cloud Checks
Visual Studio test tools, profiling, performance counters, and the SQL Azure Management Console provide a snapshot as to how the app performs.
- By Joseph Fultz
- 05/17/2012
In Part 1 of this series about Azure performance, I looked at the local machine.
Now I'm ready to put a little stress on my deployed code and collect some information. I'll make use of Visual Studio test tools, profiling, performance counters, and the SQL Azure Management Console to get a picture of how the app performs.
Setting Up the Test Harness
First, a warning: do not do this for a full-scale test. A full-scale load test would have potentially thousands of virtual users connecting from the same location and thus cause the security infrastructure to suspect that your cloud app is the victim of a DoS attack.
Setting off the DoS protection for your app could result in significant hits to time and cost. The goal here is to set up a local test and re-point it to the cloud with sufficient load to make any hotspots light up.
To get started, I've added a Test Project to my solution and added a couple of test methods to a unit test, as shown in Listing 1.
With a reference added to the service, I want to add a couple of test methods. One retrieves a specific transaction by the specific ID. I randomly picked the test ID to minimize the impact of any caching on the test execution. This is shown in Figure 1.
The second test method asks for a couple of days of data from a randomly picked store. In this case, I don't want the test method to retrieve too much data as that's unrealistic; but I do want it to be enough to potentially bring to light latency caused by serialization, marshaling types, and transferring data across machine boundaries.
I'll set up the load test by running it against the local dev fabric. The local test won't represent true performance (neither will the cloud test since profiling will be on), but what I'm really after is relative performance to catch outliers. I'm going to wave my hands over the local run since the focus here is on the cloud.
[Click on image for larger view.] |
| Figure 1. Load distribution. |
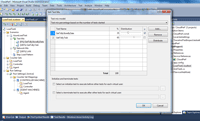
Having added a load test to my Test Project, I'm going to adjust the settings a bit. I want to get about two detail requests for every search request, so I've adjusted it appropriately in the load Test Mix. Additionally, I need to set up the overall test scenario.
[Click on image for larger view.] |
| Figure 2. Load test settings. |
I don't want to set off any warning alarms, nor do I want to take out any new loans to support my cloud habit, so this isn't the means by which I want to accomplish my actual load tests.
I do want to stress the site with more than one user, and I want to know how things might look in the cloud vs. the local tests I've run. So I set up a maximum of 25 concurrent users with no wait time on a test that will run for five minutes (Figure 2).
Finally, I'll need to modify the URI used by the proxy; that's easily accomplished by editing the endpoint address in the Unit Test project app.config, as shown here:
<endpoint address="http://jofultzazure.cloudapp.net/TestDataService.svc" binding="wsHttpBinding"
                bindingConfiguration="WSHttpBinding_ITestDataService"
                contract="CloudPerf.ITestDataService"
                name="WSHttpBinding_ITestDataService" />
In this case, I'm not making use of Visual Studio's ability to collect performance data. This would require more setup than I want to take time to do at this stage. As a different part of the overall development effort, I'll want a full test rig to exercise the application for performance and soak. That setup will leverage Visual Studio's testing features and require a little more complexity, including Azure Connect and deploying agents into the cloud. Once ready for that scenario, you can find the fully detailed steps here.
Collecting Data from the WebRole
Since I'm not collecting that data performance data in the normal Visual Studio way, I'm going to need to instrument my app to collect the primary items I'm for which I'm looking. Items that interest me the most are Test Time, CPU, GC Heap Size, Call Duration and Call Failures. There is a bounty of other metrics that I want to collect and review for a full load test, but for this purpose this information will do. The great news is that between Profiling and the Load Test information, I'll have everything except for the GC Heap information.
To collect the extra data I want I'll need to have an Azure Storage location for the performance counter logs; I also have to modify my WebRole's OnStart() method and set up the collection for the performance counters, as shown in Listing 2.
As you can see in Figure 5, I've added a setting to the WebRole (DevLoadTesting) to indicate whether or not I should load the counters I'm interested in. Additionally, since I'm running a short test I've set the collection time at five seconds.
With that bit of work, the setup is done and I can deploy the role, run the test and collect the data.
Testing and Information
When deploying the application for my quick test, I make sure to enable Profiling for the deployment, as shown in Figure 3.
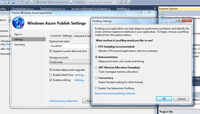
[Click on image for larger view.] |
| Figure 3. Configuring the Profiling settings. |
Note in Figure 6 that I've selected Instrumentation. As with any testing, the more precise the measurement the more the measurement will impact the test. I'm not immune to this affect, but I'm more concerned with relative performance than accurate run-time performance. So, while this will have an impact on the overall execution of the code, it's a cost worth paying, as it will net me a wealth of information. Other than that change, I deploy the application as usual.
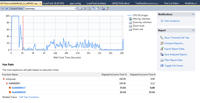
Once the application is up and running, I give it a quick check to make sure it's working as expected. In my case, this is a Web service deployment so I just make a quick pass with WCFTestClient (SOAPUI is also an excellent tool for this). Satisfied that it's running properly, I open my load test and start the run, as shown in Figure 4.
[Click on image for larger view.] |
| Figure 4. Load Test Running. |
I like to see the execution times while the test is running, but it's also important to watch the Errors/Sec. If I start receiving errors, I'll want to stop the test and investigate to figure out if the error is in the test or in the service code. With everything looking pretty good here, I can just wait out the full test execution and then get to the good stuff.
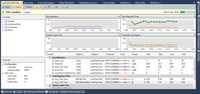
Right-clicking on the running Instance allows me to view the Profiling report. Visual Studio retrieves all the collected information, and presents a nice graph (Figure 5) showing time, CPU utilization and the hot functions listed at the bottom.
[Click on image for larger view.] |
| Figure 5. The Profiling report. |
This is the same information presented by running a local Performance Analysis (Alt+F2) from the Debug menu. By clicking on the Call Tree link at the bottom, I get to see the top-level functions and metrics related to their executions. More importantly, I can drill into the execution and see where I might be experiencing some trouble, as shown in Figure 6.
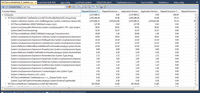
[Click on image for larger view.] |
| Figure 6. Drill-down data on performance issues. |
Obviously, my data look-up method is running a bit long and it looks like my call to AddRange() is where the bulk of the effort is. I'll need to look at ways to optimize that bit of code, maybe through not using AddRange() or even List<>. In addition to, or in lieu of, changing that I should look at caching the return.
Until Next Time
In this installment I got the app out into the cloud and ran a test against it to generate some profiling information. In the next and final installment I'll do three things:
- Review the other supporting information from SQL Azure and the counters collected on my own
- Make a couple of adjustments to improve performance
- Run the test again and look at the delta
About the Author
Joseph Fultz is a cloud solution architect at Microsoft. He works with Microsoft customers developing architectures for solving business problems leveraging Microsoft Azure. Formerly, Fultz was responsible for the development and architecture of GM's car-sharing program (mavendrive.com). Contact him on Twitter: @JosephRFultz or via e-mail at [email protected].