Mobile Corner
The Last Mile: Fit and Polish for Your Windows Phone 8.1 Application
Learn how the Windows Phone 8.1 SDK, coupled with Visual Studio, provides the necessary tools to debug, test, polish and publish your application.
- By Nick Randolph
- 06/02/2014
Whenever a new version of an SDK or Visual Studio is announced, there's a lot of fanfare about how easy it is to build applications. Most of the focus is on how to create a new application and, particularly with the latest set of announcements from Microsoft, how easy it is to build an application that will work across multiple platforms. In this article, you'll see some of the less glamorous -- but by no means less important -- features to assist in adding that last fit and finish, or polish, to your application.
Debugging Universal Applications
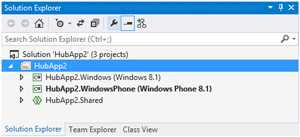
Windows Phone 8.1 will support building applications using Windows XAML, the same set of XAML used to build applications for Windows. To be clear, this doesn't mean you're building a single application that will work on either platform. Instead, you'll still have a Windows or a Windows Phone project (also known as "head" or "target platform" projects), depending on which platforms you wish to target. What's important is that because both platforms use same XAML, you can share both XAML and C# files between the projects. Microsoft has introduced the concept of a Shared files project, which is different from a traditional project because it has no binary output; instead, it keeps an index of all files to be shared between the head (or target platform) projects. Any file in the Shared project will be included as part of the build process for each of the head projects. This application architecture, with multiple head projects and a Shared project, is referred to as a Universal application, as shown in Figure 1.
 [Click on image for larger view.]
Figure 1. A Universal Application
[Click on image for larger view.]
Figure 1. A Universal Application
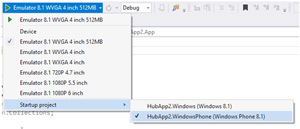
Because a Universal application actually has two startup projects (for example, the Windows and Windows Phone projects), it becomes necessary to select which project is launched when pressing F5 or running the solution. Historically, this has been done by right-clicking on the project node in Solution Explorer and selecting Set as Startup Project. This can now be done easily from the bottom of the target devices toolbox item, as shown in Figure 2.
 [Click on image for larger view.]
Figure 2. Selecting a Startup Project in the Device Toolbox Item
[Click on image for larger view.]
Figure 2. Selecting a Startup Project in the Device Toolbox Item
(Note that in Figure 2, only the Windows and Windows Phone projects are listed because the Shared project has no output and cannot be selected as a Startup Project. You can also right-click on the solution node and select Set Startup Projects where you can nominate to start both projects.)
Emulator Tools
Another area Microsoft has put a lot of effort into is the emulator. As per previous versions of the platform, the emulator is an actual build of Windows Phone, which means it's as close as possible to a real device, without actually being a real device. With Windows Phone 8, the emulation technology changed to leverage the long-term investment in Hyper-V. The Windows Phone 8.1 emulator builds on -- and improves -- this experience. The emulator now shares the same IP address as the host computer, which makes life significantly easier for debugging network requests and connecting to services hosted on the local computer.
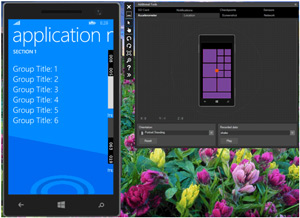
Figure 3 illustrates the Windows Phone 8.1 emulator, which has the usual toolbox for adjusting size and orientation. However, it also supports switching between a mouse cursor and touch simulation. This can be particularly useful to test gestures such as zooming in and out that require multiple touch points.
 [Click on image for larger view.]
Figure 3. The Windows Phone 8.1 Emulator
[Click on image for larger view.]
Figure 3. The Windows Phone 8.1 Emulator
There are additional tools to aid in application debugging:
- The accelerometer simulator and screenshot tabs are essentially still the same.
- The Location tab now allows for specifying a route and then varying the speed the route is traversed.
- The network tab not only holds current networking information for the emulator, but also allows for simulating a variety of network speeds and signal strengths.
- The sensor tab can be used to toggle hardware features on the emulator, to test whether or not application capabilities are correct.
- The checkpoints tab can be used to roll back the state of the emulator to a known state, useful when trying to determine if a bug has been resolved.
- The notification and SD card tabs are used to simulate notification messages being delivered to the device, and emulating an SD card, respectively.
IE Debugging
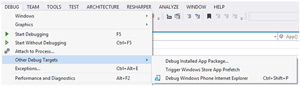
In the past, debugging Web sites or Web content hosted within a Web browser control within an application was a painful process, often relying on alert messages to determine what was going wrong. One of the slightly less obvious debugging tools that comes with the Windows Phone 8.1 SDK is the ability to attach the debugger to a Web site hosted within Internet Explorer running on Windows Phone 8.1 (see Figure 4).
 [Click on image for larger view.]
Figure 4. Debugging Web Content
[Click on image for larger view.]
Figure 4. Debugging Web Content
The Debug Windows Phone Internet Explorer option will launch a specific URL and allow you to query the DOM, set breakpoints in JavaScript and tweak CSS for the current Web page. What's hidden away is that you can actually use the same debugging capabilities for Web pages hosted in a WebView within a Windows XAML application. From the Debug tab of the Properties page for the application, in the Debugger type set the Application process dropdown to Script. When a WebView is encountered in your application, you'll be able to interact with the DOM, JavaScript and CSS in the same way as if the Web page had been launched in Internet Explorer.
Power Tools
The Windows Phone 8.1 menu item in the Tools menu has options for Developer Power Tools, Developer Unlock and Application Deployment. The latter two are the same tools that have shipped with previous versions of the Windows Phone SDK, updated for Windows Phone 8.1. They allow a device to be developer-unlocked and deploy an application to a device or emulator. The new Developer Power Tools include Application Verifier, Performance Monitor and Performance Recorder tabs, as shown in Figure 5.
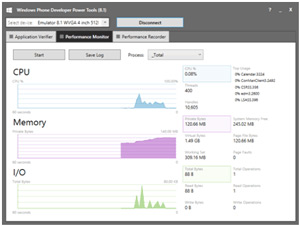 [Click on image for larger view.]
Figure 5. Monitoring Performance with the Developer Power Tools
[Click on image for larger view.]
Figure 5. Monitoring Performance with the Developer Power Tools
The other tool in the same vein is the Performance and Diagnostics menu item, via the Debug menu. This opens up a diagnostic recording session allowing you to select CPU Usage, Energy Consumption, XAML UI Responsiveness and Memory Usage. An example of a session run for a simple application is shown in Figure 6, where you can see a graphical output of the session. You can then select a region and drill in for much more detailed information and links to your code where relevant.
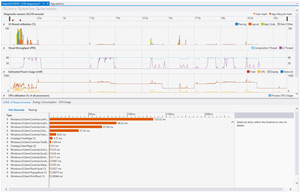 [Click on image for larger view.]
Figure 6. Windows Phone 8.1 Diagnostic Information
[Click on image for larger view.]
Figure 6. Windows Phone 8.1 Diagnostic Information
Device Debugging
Though the emulator is sufficient for most of the development process, as you approach the final stretch of your application you'll want to test your app on a number of actual hardware devices. In the past it wasn't that important to test on different devices, as long as it was tested on at least one real device. With Windows XAML in Windows Phone 8.1, the design of your application is no longer restricted to 480 units wide; instead, the width of your application is tied to the physical size of the device on which it's run. For this reason it's important to get a range of device sizes on which to test functionality.
To debug an application on a hardware device, that device needs to be developer-unlocked, similar to previous versions of Windows Phone. Essentially, this means connecting the device to a computer with the Windows Phone SDK installed. Run the Developer Unlock tool, enter Microsoft Account (formerly Windows Live ID) credentials that map to a Windows Phone Store account, and click the Register button. After completing this process you should be able to select Device from the target device dropdown in Visual Studio then run your application. It will automatically be deployed to the device and executed with the debugger attached, in the same way as if the application had been run on an emulator.
Beta Program
Having to developer unlock phones used for testing is sufficient if the number of handsets is small (and, in fact, there's a limit on the number of devices any one account can unlock). To distribute an application for testing to a larger number of users, you can use Microsoft's Beta program. This involves submitting the XAP (for Silverlight 8.0 or 8.1) or APPX (Windows XAML) via the same process you'd go through for submitting an application for certification. However, you indicate that you want to send the application out for Beta testing. In doing this you'll have to nominate the Microsoft Account with which the users sign into their devices. Microsoft will handle the signing and publishing of your application to their CDN without going through the certification process. Once this has been completed you'll be notified and can then distribute the application link to the nominated tester list. If the link's distributed to other users, they won't be able to install the application unless they're nominated testers.
Enterprise Distribution
An alternative to using the Beta program is to self-sign your application. This was enabled for Silverlight 8.0 applications in Windows Phone 8 and has been extended to both Silverlight 8.1 and Windows XAML applications in Windows Phone 8.1. In summary, self-signing involves acquiring an enterprise signing certificate from Symantec (it has to be a certificate specifically for Windows Phone application signing) and then running one of the following Windows PowerShell scripts (note that for Windows XAML you need to create the APPX package first via the Project | Store | Create App Package menu item; select the option that isn't for uploading to the Store):
C:\Program Files (x86)\Microsoft SDKs\Windows Phone\v8.0\Tools\MDILXAPCompile\BuildMDILXap.ps1 C:\Program Files (x86)\Microsoft SDKs\Windows Phone\v8.1\Tools\MDILXAPCompile\BuildMDILSL81XAP.ps1 C:\Program Files (x86)\Microsoft SDKs\WindowsPhoneApp\v8.1\Tools\MDILXAPCompile\BuildMDILAPPX.ps1
Once signed you can distribute the certificate and the application via a secure channel (such as an SSL-enabled Web site or IRM protected e-mail). Clicking on the attachment will install the certificate and application on the target device. More information on this process is available on the Windows Phone Dev Center.
Build It Beta
Finally, there's a third-party tool, Build it Beta, which can deploy an application for testing to a limited set of users. To start using Build it Beta, install the Windows or Windows Phone application from the relevant Store and sign in with your Microsoft, Facebook, Twitter or Google account. You'll need to nominate an e-mail address from which new application versions will be received. The setup process can be a bit fiddly initially, but it's well worth the effort once it's up and running.
After setting up Build it Beta, e-mail the XAP or APPX built by Visual Studio to upload@builditbeta. Using your e-mail address to locate your account, the application will be attached to your account and appear within Build it Beta. If you're running Build it Beta on your Windows Phone, you can then nominate to install and run the application. A tester can be added to an application by invitation via his e-mail address.
Behind the scenes, Build it Beta signs your application and uses the enterprise deployment support within Windows Phone to install and run it. Be aware that Build it Beta injects a minimal set of code into your application. This provides information about the application version you're testing on application startup, and the built-in feedback submission tool that's available by swiping from the top of the screen (just under the system tray and notification/action center). Subscribing to Build it Beta will allow you to customize this experience and remove any of the Ad content.
In this article, you've seen a number of the new debugging and diagnostic tools available within Visual Studio and the Windows Phone 8.1 SDK. All these tools combine to help reduce the time needed to test and tune an application for certification. The new debugging support for Internet Explorer on Windows Phone alone will significantly reduce the time taken to find bugs and improve mobile site performance. Knowing about -- and how to use -- the additional tools that ship with Visual Studio are what differentiates great developers from the rest.
About the Author
Nick Randolph runs Built to Roam, a consulting company that specializes in training, mentoring and assisting other companies build mobile applications. With a heritage in rich client applications for both the desktop and a variety of mobile platforms, Nick currently presents, writes and educates on the Windows Phone platform.