Code Focused
Make The Debugger Focus on Code That's Important To You
When you debug a C++ application, the debugger can take a number of detours through lots of trivial functions or code from third-party libraries. You can filter out those unnecessary paths and have the debugger focus on just the code you want.
- By Bartlomiej Filipek
- 08/24/2016
When I introduced you to this article series, you might remember that I noted that stepping into/over/out of function calls is essential while debugging. Unfortunately, it would be very time consuming to visit all of the code. Sometimes the debugger might lead you to methods that aren't important from your perspective.
Let's look at an example:
class SimpleParam
{
public:
    SimpleParam(const std::string& str, int val) : mStr(str), mVal(val)
    {
        Init();
    }

    void Init() { }
    std::string GetStrVal() const { return mStr + std::to_string(mVal); }

private:
    std::string mStr;
    int mVal;
};

void CallBackFunction(SimpleParam p1, SimpleParam p2)
{
    std::cout << p1.GetStrVal() << "\n";
    std::cout << p2.GetStrVal() << "\n";
}
/// ...
CallBackFunction({ "Hello", 1 }, { "World", 2 });
Set a breakpoint at the line where CallBackFunction is called and then try to press Ctrl+F11 to step into it. Where will the debugger go? I see something like Figure 1.
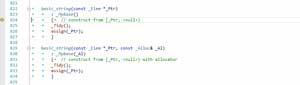 [Click on image for larger view.]
Figure 1. Debugger Takes a Side Trip
[Click on image for larger view.]
Figure 1. Debugger Takes a Side Trip
In this example, the debugger goes to the code that's available to the debugger -- in this case, it's a constructor of std::string! You can probably be sure that nothing wrong can happen in that library code.
Now, imagine what happens if you have several parameters. When you want to step into a method, you'll first need to visit all code related to the parameters creation. The whole process might be frustrating, and you lose a lot of time before going into the target function. Of course, you might just set a breakpoint at the beginning of the destination code so you can skip all of the unwanted behavior. But there is a better option.
What if you could control and filter out unwanted functions? Prior to Visual Studio 2012, it's relatively tricky to filter out the code and involves playing with some registry values. Fortunately, with Visual Studio 2012 and later, this useful feature was greatly improved. All you need to do is edit the default.natstepfilter Xml file. For Visual Studio 2015, that file is usually located in Program Files (x86)\Microsoft Visual Studio 14.0\Common7\Packages\Debugger\Visualizers (the location is similar in Visual Studio 2012 and Visual Studio 2013).
To add a functions filter, you can use regex expressions. So, in this example, when you want to skip all the std:: function call you can write the following:
std\:\:.*
and add the following line to default.natstepfilter:
<Function>
    <Name>std\:\:.* </Name>
    <Action>NoStepInto</Action>
</Function>
Please note that the file might be blocked for writing. The file default.natstepfilter is loaded each time a debugger session starts.
You can now set up the most common functions in your project that you don't want to visit during debugging. Usually, those are trivial functions or from third-party code (std, boost?), but just be careful: go overboard and you might filter out too much!
About the Author
Bartlomiej Filipek is a software developer in Poland who specializes in C++, Windows and graphics programming. He worked for a number of companies developing multimedia, document editors, games, graphics drivers and flight planning systems, and has taught game development at local university. Follow Bart's blog at http://www.bfilipek.com and on Twitter @fenbf.