In-Depth
A .NET Developer's Life, or How To Do Production Debugging on the Fly
A case study in swift .NET application debugging using a variety of free tools that can help keep a client happy.
- By Kamran Bilgrami
- 09/29/2016
Over the years I've been involved in troubleshooting some nasty production issues in a number of projects. One of the main reasons these issues have been quite tricky to troubleshoot was because the issues often weren't easily reproducible in-house. Such types of bugs usually escape the QA testing lifecycle and are discovered only after deployment to a production environment. At that stage in a product lifecycle, these bugs are revenue impacting, which means that an investigating engineer will be under extra pressure to resolve any problem swiftly. Depending on the type of problem, I use various production-grade tools and techniques to troubleshoot these issues and determine the root cause of the problem. In this article, I walk through one of these scenarios.
Naturally, the approaches I describe here aren't the only possible solutions. There can certainly be other methodologies to solve these problems. The approach described here is what I used in a certain scenario based on my knowledge and real-world experience, and I'll welcome reader comments and suggestions for other solutions. In order to protect customer privacy and any potential confidentiality conflicts, I've obscured some sections in the figures included here. Rest assured, the flow of troubleshooting steps remains unchanged.
What Is Production Debugging?
Production debugging is all about solving customer-facing issues that aren't easily reproducible. Take, for example, a common problem of a fast-food restaurant kiosk that goes offline with a blue screen of death. That restaurant loses its ability to accept orders from customers, of course, but it also can disrupt workflows and bring chaos to other parts of the business operations. If the problem can be traced to a hardware issue, hardware can be quickly replaced. But in the case of software issues, replacing hardware will be of no help. Software vendors have to fix the issue, and that, in turn, requires being able to reproduce the scenario first.
Reproducing such issues in a lab environment is the key to finding the root cause: If the issue cannot be reproduced, that makes such problems really hard to solve. One methodology for solving this type of problem is based on the Dump File approach. (If you are unfamiliar with the Dump file-based approach, a good starting point for understanding it is this article I wrote for CODE magazine.). At a high level, a dump file-based approach requires capturing a snapshot (aka dump file) of the problematic process first, and then analyzing it to find the root cause.
There are two main goals of production debugging:
- Find actionable information: Most dump file analysis tools can provide useful information, but that information may not lead to specific actions to fix the issue. As an example, a dump file from a typical production application almost always shows a large number of byte arrays and string data type allocations in memory. But this information may not give anything specific that you can take as an action item to be fixed in the code or in the environment.
- Find that actionable information fast: Because production issues can negatively impact customer revenues and SLAs, the longer the issue persists, the worse effect it can have on their KPIs. Therefore, it's critical to find that actionable information as quickly as possible. The more time it takes to find and fix the issue, the more pressure is added on everyone in the troubleshooting team. Coming up with a resolution fast sometimes requires going beyond status quo methodologies.
Imagine the following scenario: A customer opened an urgent critical support ticket about Internet portal services. The problem was that the portal was working extremely slowly and hindering users from performing day-to-day tasks. The customer raised the concern that this was not only impacting the company revenues, but putting the company at the brink of missing monthly SLA targets.
We use IIS for hosting these services. Our support technicians looked into the issue and found that IIS memory usage was significantly higher than normal. This application's typical memory consumption was between 400MB and 600MB, but in this case it was consuming almost 1.8GB. Support tech looked through the application and system logs but didn't find any obvious reasons to explain the high memory consumption. At that point, they escalated the issue to a higher tier and that's where I came into the picture. I recommended collecting a couple of dump files for affected w3wp processes. After receiving the dump files, I started deciphering the reasons behind the high memory consumption of this process. Let's go through the tools.
PerfView
In my first attempt at solving the issue, I first used PerfView. Microsoft's powerful and free performance analysis tool can be used to analyze memory- and CPU-related problems. If you haven't used this before, Microsoft .NET Performance Architect Vance Morrison has published a series of PerfView video tutorials in the Channel 9 and Defrag Tools sites. PerfView is well suited for use in a production environment, as it comes as a single executable file that can easily be XCopy'd to the target environment. For memory analysis, PerfView can be used in two different modes:
- By capturing a heap snapshot against a target process
- By taking a snapshot from a dump file
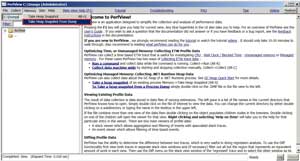
I opted for the second option (see Figure 1) as we had already collected the process dump files from the production environment.
 [Click on image for larger view.]
Figure 1. Taking a Heap Snapshot from a Dump File in PerfView
[Click on image for larger view.]
Figure 1. Taking a Heap Snapshot from a Dump File in PerfView
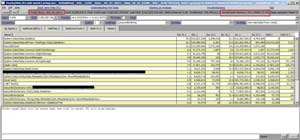
Figure 2 shows PerfView after the heap snapshot was generated from the dump file. It provides a list of objects and the memory consumed by instances of those objects. The Exc% and Exc Count columns provide Exclusive costs associated with a particular type, whereas the Inc% and Inc Count columns provide costs associated with a particular type, as well as all its children recursively. This view shows the most memory-expensive objects at the top of the grid. In case of high memory issue, focus should be on the objects that are most costly. This means that the System.Data.DataRow objects are contributing about 51.1 percent toward memory cost. The other items in the grid have their role in memory consumption, but those aren't as close as System.Data.DataRow objects.
 [Click on image for larger view.]
Figure 2. PerfView Snapshot from the w3wp Process Dump File
[Click on image for larger view.]
Figure 2. PerfView Snapshot from the w3wp Process Dump File
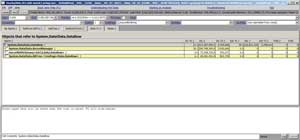
One of the cool features of PerfView is that clicking through the nodes shown in the grid takes you through the objects that are referencing the objects in question. This means that clicking through the nodes will eventually take you to a parent object that's causing child objects to remain in memory. So I double-clicked on the System.Data.DataRow node and navigated to the Referred-From tab in Figure 3.
 [Click on image for larger view.]
Figure 3. PerfView Referred From Tab
[Click on image for larger view.]
Figure 3. PerfView Referred From Tab
This tab shows that System.Data.DataRow objects are referred by the following objects:
- System.Data.RecordManager
- Dictionary<int, System.Data.DataRow>
- System.Data.RBTree+TreePage<System.Data.DataRow>
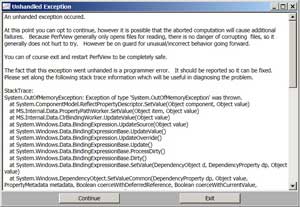
Because RecordManager is on top of the list in that grid, that means it holds references to most memory-consuming DataRow objects. In order to find out more about this chain of reference, I just needed to click through the node. However, when I did that, PerfView popped up a dialog indicating that it had encountered some internal error due to an Out of memory condition (Figure 4). I clicked on the other two nodes listed in Referred-From tab for DataRow object but encountered the same fate.
 [Click on image for larger view.]
Figure 4. PerfView Encountering Its Own OutOfMemory Error
[Click on image for larger view.]
Figure 4. PerfView Encountering Its Own OutOfMemory Error
Even though it's an extremely useful tool that I've used many times successfully to troubleshoot production issues, PerfView was just not ready to help me this time. It provided me some useful information in terms of objects that were consuming the most memory, but it just wasn't enough to take a specific action to fix the root cause of the problem.
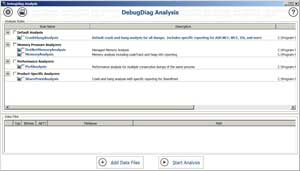
DebugDiag
Next, I turned to DebugDiag, another free Microsoft tool. DebugDiag provides a rich set of rules that can be used to collect and analyze dump files. It has two components, one for dump file collection and another one for analyzing that dump file. Here, I'll focus on how I used the DebugDiag Analysis tool with an already collected dump file. Figure 5 shows the DebugDiag Analysis component, which comes with built-in rules for dump file analysis. You can add one or more dump files for analysis and then select rules that are appropriate for specific issues under investigation.
 [Click on image for larger view.]
Figure 5. DebugDiag Analysis Application with Analysis Rules
[Click on image for larger view.]
Figure 5. DebugDiag Analysis Application with Analysis Rules
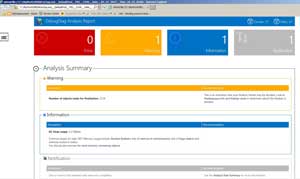
DebugDiag Analysis outputs to a report in the form of an HTML file containing analysis results. Figure 6 shows the key parts of the analysis from the dump file when running the DotNetMemoryAnalysis rule against that dump file. The top banner shows a summary of errors/warning/information. The warning section describing the number of objects that are ready for finalization. The information section shows that GC heap size is about 1.2GB.
 [Click on image for larger view.]
Figure 6. DebugDiag Analysis Report -- Error/Warning/Information/Notification
[Click on image for larger view.]
Figure 6. DebugDiag Analysis Report -- Error/Warning/Information/Notification
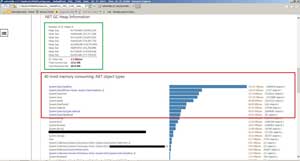
Scrolling down in the report is more information about the breakdown of overall memory across number of heaps (see Figure 7). The next section lists 40 of the most memory-consuming objects. Consistent to what can be seen in PerfView, System.Data.DataRow is at the top of the list.
 [Click on image for larger view.]
Figure 7. DebugDiag Analysis Report -- .NET GC Heap Info and 40 Most Memory-Consuming Object Types
[Click on image for larger view.]
Figure 7. DebugDiag Analysis Report -- .NET GC Heap Info and 40 Most Memory-Consuming Object Types
With the help of PerfView and DebugDiag, I determined that it was the System.Data.DataRow objects that were responsible for most memory consumption within the IIS process. All of us who have experience with data-centric applications know that DataRow objects are populated as a result of queries performed against the database. This, of course, is helpful information that I could use to build an initial theory about the problem, but there wasn't much in these reports to give me anything concrete to fix it.
At this point my thought was that some database queries are probably retrieving lots of data. The problem is that in this application, there are hundreds (if not thousands) of queries performed against the database. Without knowing more about the actual queries, it's really hard to predict what part of the code is responsible for the application's high memory consumption. Running SQL Profiler against this application was a theoretical possibility (to find all running queries), but that alone could be a mammoth task that could take a long time. We needed something fast to take this customer out of its misery. The customer was literally willing to abandon using our product unless something was done immediately. With every minute ticking, pressure was building up, so we looked to other tools to get better answers.
Windbg
I then turned to another free Microsoft tool, Windbg, a native debugger that's part of the Debugging Tools for Windows. Given the firepower and flexibility that Windbg offers, it's a favorite. Because Windbg is a native debugger, it doesn't understand managed code without the help of Extension DLLs. These DLLs give the ability to glean into internal data structures of managed heap. Son of Strike (SOS) is one commonly used extension that comes as a part of the .NET Framework. Figure 8 shows Windbg after loading the collected dump file. I then ran the command to load SOS.
 [Click on image for larger view.]
Figure 8. Loading SOS Extension DLL in Windbg
[Click on image for larger view.]
Figure 8. Loading SOS Extension DLL in Windbg
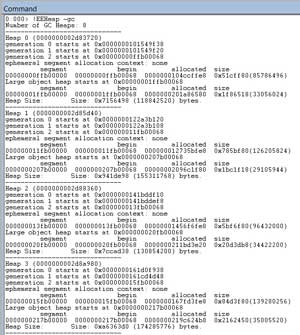
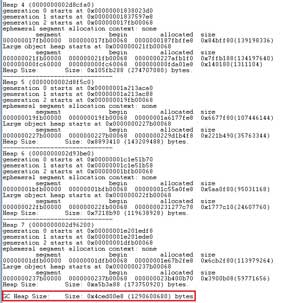
Typically, when dealing with memory issues, I start with the EEHeap command, which summarizes the managed heap usage across various GC heaps. Figure 9 and Figure 10 show the output. From Figure 10 we could tell that the total GC heap size is ~1.2GB, which was consistent to the DebugDiag report.
 [Click on image for larger view.]
Figure 9. Windbg EEHeap Command Output
[Click on image for larger view.]
Figure 9. Windbg EEHeap Command Output
 [Click on image for larger view.]
Figure 10. More Windbg EEHeap Command Output
[Click on image for larger view.]
Figure 10. More Windbg EEHeap Command Output
Next, let's look at all the objects that are present in the managed heap. The DumpHeap command with a stat switch can be used for this purpose (see Figure 11). I'm not going to explain DumpHeap in too much detail (read Tess Ferrandez's Developer blog post to find out more). Suffice it to say that it shows all the objects on the managed heap along with count and size of respective objects. In a typical production application, this list could be really long. Figure 11 shows the initial part of its output for brevity.
 [Click on image for larger view.]
Figure 11. Windbg DumpHeap –stat Command Output
[Click on image for larger view.]
Figure 11. Windbg DumpHeap –stat Command Output
The output of DumpHeap is sorted in an ascending order by size, with the object consuming the most memory at the bottom of the output (see Figure 12).
 [Click on image for larger view.]
Figure 12. More Windbg DumpHeap –stat Command Output
[Click on image for larger view.]
Figure 12. More Windbg DumpHeap –stat Command Output
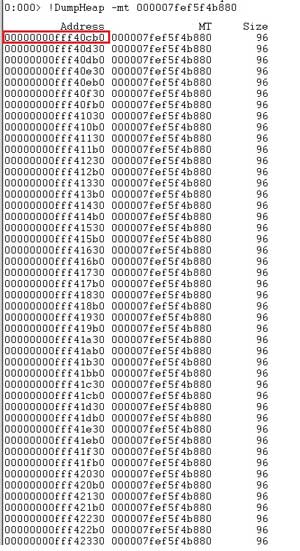
Just as we saw with PerfView and DebugDiag, System.Data.DataRow is consuming most memory with more than 3 million objects accounting for 327MB. What I really needed then was to find out where all these DataRow objects were referenced in the objects graph. For that, I first needed to determine the memory address of these objects and then run a GCRoot command against that address to find the root of each object (this article has a refresher about roots in GC). As Tess pointed out in her blog post, the DumpHeap command can be used with the mt switch to find the addresses of all the objects for a particular object type. I needed these object addresses because that's what's needed to use the GCRoot command. The output of this command will list memory addresses of all 3 million DataRow objects (Figure 13).
 [Click on image for larger view.]
Figure 13. Windbg DumpHeap –mt Command Output
[Click on image for larger view.]
Figure 13. Windbg DumpHeap –mt Command Output
Let's take the first object address from this list (in Figure 13, it's marked with a red rectangle) to try to find its root. First, I ran the do (Dump Object) command for dumping the object at a particular memory address. Figure 14 shows the output, with different fields for the System.Data.DataRow object in this particular instance.
 [Click on image for larger view.]
Figure 14. Windbg Do Command Output
[Click on image for larger view.]
Figure 14. Windbg Do Command Output
Next, I ran the GCRoot command to find out where this particular object was rooted. However, as shown in Figure 15, it didn't show me any roots.
 [Click on image for larger view.]
Figure 15. Windbg GCRoot Command Output
[Click on image for larger view.]
Figure 15. Windbg GCRoot Command Output
I repeated this process of running GCRoot on many of the System.Data.DataRow instance memory addresses (which I found via DumpHeap –mt, as shown in Figure 13) but none of those produced any roots.
Just like with PerfView and DebugDiag, I found useful information with Windbg but nothing actionable. I could've continued with finding the roots approach by using Steve Johnson's SOSEX extension DLL. It has a powerful refs command that nicely supplements the SOS GCRoot command with additional capabilities, but in my experience when you're dealing with a large managed heap, this type of analysis can get tricky and time-consuming. You really don't need to analyze every object present in the heap. In this particular case, obviously the large number of System.Data.DataRow objects is what needed the greatest focus. And, just analyzing the sheer amount of objects here -- more than 3 million -- can turn into a daunting task. Running any scripts against that many objects would be slow and time-consuming; I needed something fast.
This is when I thought of trying an entirely different approach, one in which the worst case may not give me any clues, but it would provide a quick turnaround either way.
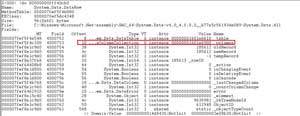
Let's take a step back and think about the problem in hand and what data could be interesting to look into. As most of us know, a System.Data.DataRow object is used to represent a data row from a DataTable object, which could be the result of a SQL Query. I knew in this particular application, many many queries were performed against the database. So the key piece of information I really needed was the SQL query that could be responsible for populating one or many of these System.Data.DataRow objects. In order to understand how that SQL Query can be found, check out this MSDN post on Browsing .NET Reference Source, which will help in inspecting the internals of the DataRow class. In Figure 16, you'll see that DataRow has a DataColumnCollection instance called _columns.
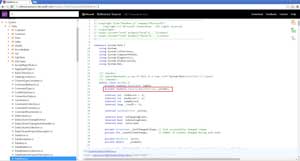 [Click on image for larger view.]
Figure 16. DataRow Class
[Click on image for larger view.]
Figure 16. DataRow Class
If we browse to the DataColumnCollection class in the .NET source code, it contains a Dictionary<string, DataColumn> field called columnFromName. As shown in Figure 17, the comments for this particular field states that it links names to columns. This basically means that if we can somehow get to this Dictionary object, then we should be able to find all column names for the respective DataRow object.
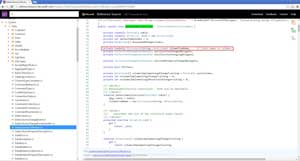 [Click on image for larger view.]
Figure 17. DataColumnCollection Class
[Click on image for larger view.]
Figure 17. DataColumnCollection Class
Let's go back to the dump of the DataRow object in Figure 15 that shows the DataColumnCollection instance outlined in red. Let's take the address of that DataColumnCollection instance and dump its contents using the do command (see Figure 18).
 [Click on image for larger view.]
Figure 18. Windbg DataColumnCollection Instance Fields
[Click on image for larger view.]
Figure 18. Windbg DataColumnCollection Instance Fields
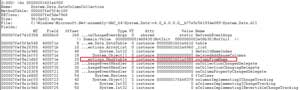
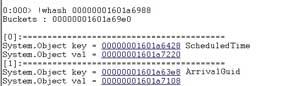
Just as we can see in its source code, this instance of DataColumnCollection contains a columnFromName field. I should now be able to get a list of column names for this DataRow instance. In order to inspect the columnFromName object, let's load another extension DLL, netext, available on the CodePlex site. This DLL from Microsoft Support Engineer Rodney Viana has some very powerful commands that I use on a regular basis for dump files analysis. In this case, I first used its whash command to retrieve contents of columnFromName (see Figure 19). The key of this dictionary has the name of columns, and the output when running whash results in two column names, ScheduledTime and ArrivalGuid.
 [Click on image for larger view.]
Figure 19. Windbg whash Command Output
[Click on image for larger view.]
Figure 19. Windbg whash Command Output
Now this is what I call a good start towards finding something actionable. But in order to further narrow my search for the root cause, I needed some way to determine which query was retrieving these column names. For that, let's take a look at the SqlCommand class. This class is used to represent SQL statements to execute against a SQL Server database. I knew the application used SQL Server and SqlCommand was used in fetching data from its database. As shown in Figure 20, SqlCommand contains a _commandText field.
 [Click on image for larger view.]
Figure 20. SqlCommand Class
[Click on image for larger view.]
Figure 20. SqlCommand Class
Based on my previous experience working with this class, I knew that _commandText contains the actual SQL query that's been executed. What I really needed to do was to see if the dump file had any SQL query instances that contain the ScheduledTime and ArrivalGuid columns, which could be linked to the DataRow object instances I was interested in. That query should have given me the name of the database table, which could get me closer to the root cause. For finding that query, I used the netext's wfrom command. With wfrom, you can search through all instances of a particular type and filter any fields for that type, as well. As shown in Figure 21, I scripted my next command to search through SqlCommand type instances where the _commandText field contains both ScheduledTime and ArrivalGuid columns.
 [Click on image for larger view.]
Figure 21. Windbg wfrom Command Output
[Click on image for larger view.]
Figure 21. Windbg wfrom Command Output
Well, it looked like I had found something actionable. With those tools, I was able to find the exact query that contained these two columns. This query, of course, contained the table name TaskProcessor. I repeated the same process for a few more DataRow instances and all ended up pointing to the same query.
That made me question what was in the TaskProcessor table. I logged into the customer database to query it. To my surprise, this TaksProcessor had more than 3 million rows also, which was quite unusual. It typically contained no more than 10,000 rows. There was a SQL job for archiving historical data from this table. Turned out that job was failing for quite some time and the alerts on job failures were misconfigured -- as a result, no one was getting notifications about the failures. Long story, short: As soon as data was archived from TaskProcessor, memory consumption went back to its normal state and our customer was also back in business.
Until next time, happy debugging! I'd love to hear your comments!