News
Rider .NET IDE Tackles Much-Requested Blazor WebAssembly Debugging
Client-side debugging of Blazor WebAssembly apps, a hot topic among developers, is being addressed in the Rider .NET IDE from JetBrains, starting with a new Early Access Program build.
While it's a much-requested feature, such debugging has been slow to come to Blazor WebAssembly, which Microsoft debuted in May 2020 in v3.2. While that release lagged behind the client-side component, Blazor Server, full-functioning debugging lagged even further.
The latest Blazor WebAssembly debugging guidance from Microsoft, dated August 2020, revealed that developers can debug from within Visual Studio for Windows, Visual Studio for Mac and Visual Studio Code -- but only with the support of recent Chromium-based web browsers (Edge and Chrome). However, even with that said, Microsoft indicated developers can't:
- Break on unhandled exceptions.
- Hit breakpoints during app startup before the debug proxy is running. This includes breakpoints in
Program.Main (Program.cs) and breakpoints in the OnInitialized{Async} lifecycle methods of components that are loaded by the first page requested from the app.
- Debug in non-local scenarios (for example, Windows Subsystem for Linux (WSL) or Visual Studio Codespaces [note: this is now GitHub Codespaces]).
- Automatically rebuild the backend
*Server* app of a hosted Blazor WebAssembly solution during debugging, for example by running the app with dotnet watch run.
Things that developers can do include:
- Set and remove breakpoints.
- Run the app with debugging support in IDEs.
- Single-step through the code.
- Resume code execution with a keyboard shortcut in IDEs.
- In the Locals window, observe the values of local variables.
- See the call stack, including call chains between JavaScript and .NET.
Which brings us back to JetBrains, aiming to provide the best IDE for .NET with Rider. Many developers claim it already is, and Rider is typically listed highly in rankings of such IDEs, like this one and this one.
Being the best .NET IDE presumably requires superior Blazor WebAssembly debugging, and Rider started to tackle that last week with the debut of the pre-release 2021.2 EAP build 212.3724.19.
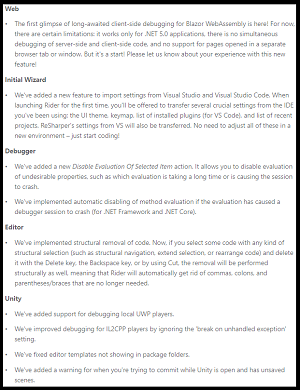
 [Click on image for larger view.] The Rider EAP Build (source: JetBrains).
"The first glimpse of long-awaited client-side debugging for Blazor WebAssembly is here!" JetBrains said. "For now, there are certain limitations: it works only for .NET 5.0 applications, there is no simultaneous debugging of server-side and client-side code, and no support for pages opened in a separate browser tab or window. But it's a start! Please let us know about your experience with this new feature!"
Rider developers haven't been shy about letting JetBrains know how they feel, especially on the company's YouTrack site where there's a thread on Blazor WebAssembly Client-Side Debugging, started about a year ago. The thread asked "Is blazor webassembly debugging going to be supported in 2020.2? or can you give a roadmap for blazor as it has been released and fully supported by microsoft." Many -- if not dozens of -- comments decried the lack of debugging functionality when compared to Visual Studio.
For example, comments in the thread included:
- Is there a way to prioritize this issue? I am past the phase of prototyping with blazor wsam and am convinced it is a best option for some use cases. Having full support in Rider would be great for the future of Rider and blazor. Save us from visual studio!
- Cant agree more with @Sean M, as Blazor WebAssembly is now considered production ready by Microsoft since May 2020. Any updates, plans or thoughts from JetBrains?
- Come on JetBrain - Should I go back to VS?
- Really love Rider, but we absolutely need a way to debug Blazor WASM and an update on the roadmap. Currently I have to debug with Visual Studio 2019 and its possible to do it in VS Code as well with a little more setup.
- This one definitely gets my vote - having to switch to VS just for Blazor wasm debugging just reminds me what a sloth it is.
While debugging didn't make it into the 2020.2 release, it's headed for the 2021.2 release.
"Hey folks, From the first 2021.2 EAP Blazor WASM debugging will be available as a part of launchSettings run configuration, just follow MSDN tutorial [note: this is the same Microsoft guidance mentioned above] and click Debug button," says a comment last month apparently from a JetBrains employee. "Looking forward to your feedback, the feature might evolve and change until 2021.2 release. P.S. JavaScript Debugger and Razor plugins must be installed, otherwise the feature won't work."
As far as when 2020.2 will debut, another presumed JetBrains employee said: "while I'm not allowed to publish any exact dates (or even estimates), I can say that we have roughly the same release schedule every year, 2020.1 was released in April, and 2020.2 was released in August of 2020."
So stay tuned for further developments about two months from now.
About the Author
David Ramel is an editor and writer at Converge 360.