News
JavaScript Debugging Now Built-In to VS Code
Microsoft has created a built-in JavaScript debugger for Visual Studio Code, the wildly popular, open source-based, cross-platform code editor.
The company's Edge browser development team recently announced that JavaScript developers in VS Code can now uninstall the Debugger for Chrome and/or the Debugger for Edge extensions for a new, simplified debugging experience.
That built-in experience comes via vscode-js-debug, a GitHub project described as a Debugger Adapter Protocol-based JavaScript debugger that works with Node.js, Chrome, Edge, WebView2 and VS Code extensions. It has been the default JavaScript debugger in Visual Studio Code since 1.46 (we're now at v1.58) and is even being rolled out into the Visual Studio IDE.
The new debugger can be used without having to install any extensions in three ways:
- Pressing F5 (Start Debugging)
- Activating the debug icon in the menu bar and selecting "Run and debug"
- Opening the Visual Studio Code command palette and running the "Debug: Open Link command"
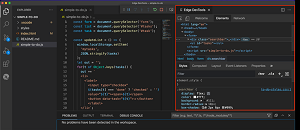
 [Click on image for larger view.] Edge Dev Tools in VS Code (source: Microsoft).
Those choosing to debug with Edge will see a new inspect button that can be clicked to install and launch the Microsoft Edge Tools for VS Code extension in order to be able to do things like inspect the DOM, change CSS styling and see network requests of a project running in the browser -- all from within the VS Code instance. That installation only needs to be done once.
"As a bonus, you can also use the Debug Console in the editor to interact with the document in the browser, much like you would with the Console in the browser developer tools," Microsoft said. "You have full access to the window object and can use the Console Utilities API."
About the Author
David Ramel is an editor and writer at Converge 360.