The Data Science Lab
Chi-Square Test Using C#
A chi-square (also called chi-squared) test is a classical statistics technique that can be used to determine if observed-count data matches expected-count data.
A chi-square (also called chi-squared) test is a classical statistics technique that can be used to determine if observed-count data matches expected-count data. For example, suppose you have three Web server machines that are designed to handle 50 percent, 25 percent and 25 percent of your traffic respectively. If you observe 1,000 HTTP requests, you'd expect to see about 500 requests handled by the first server, 250 requests handled by the second server and 250 requests handled by the third server.
But suppose your actual observed counts are (529, 241, 230). Do you conclude that the differences between observed and expected counts are simply due to randomness, or do you conclude there's statistical evidence that your Web servers are not handling traffic as intended? This is an example of a chi-square goodness of fit test.
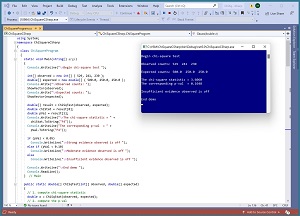
A good way to see where this article is headed is to take a look at a screenshot of a demo program in Figure 1. The demo sets up observed counts of (529, 241, 230) and expected counts of (500.0, 250.0, 250.0). In a chi-square test, observed counts will be type integer but expected/theoretical counts are often type double.
The three key output statements of the demo program are:
The chi-square statistic = 3.6060
The corresponding p-val  = 0.1648
Insufficient evidence observed is off
The chi-square statistic is a single value that measures the difference between observed counts and expected counts. A chi-square statistic value of 0.0 means the observed and expected counts match exactly. The larger the value of the statistic, the larger the difference between observed and expected counts.
 [Click on image for larger view.] Figure 1: Chi-Square Test Demo
The p-val ("probability-value") is, loosely speaking, the likelihood that the observed and expected counts agree. So, a small p-value, such as 0.03 (3 percent), indicates a mismatch between observed and expected. In this case, the p-value of 0.1648 is small but isn't small enough to conclude that something is wrong. In other words, the difference between the observed and expected counts is somewhat suspicious but the difference could have happened by chance fluctuations in the data.
This article assumes you have intermediate or better programming skills but doesn't assume you know anything about chi-square goodness of fit tests. The demo program is coded using C# but you should have no trouble refactoring the code to another language such as JavaScript or Python. All the demo code is presented in this article and is also available in the accompanying download.
Understanding the Chi-Square Test
A chi-square test has two steps. First, observed and expected counts are used to compute a chi-square statistic, which is a measure of how different the counts are. Second, the chi-square statistic is used to compute a p-value, which is a measure of the likelihood that the counts agree.
The chi-square statistic is defined as the sum of the squared differences between observed and expected divided by expected:
chi-square = sum( (obs[i] - exp[i])^2 / exp[i] )
The idea is best explained by an example. Suppose, as in the demo, the observed counts are (529, 241, 230) and the expected counts are (500, 250, 250). The calculated chi-square statistic is:
chi-square = (529 - 500)^2 / 500 +
             (241 - 250)^2 / 250 +
             (230 - 250)^2 / 250

           = (841 / 500) + (81 / 250) + (400 / 250)
           = 1.6820 + 0.3240 + 1.6000
           = 3.6060
The demo implements this function as:
public static double ChiSqStat(int[] observed,
  double[] expected)
{
  double sum = 0.0;
  for (int i = 0; i < observed.Length; ++i) {
    sum += ((observed[i] - expected[i]) *
      (observed[i] - expected[i])) / expected[i];
  }
  return sum;
}
There's no error-checking for simplicity but in a production system you'd want to make sure that arrays observed an expected have the same length, and so on.
Computing the P-Value
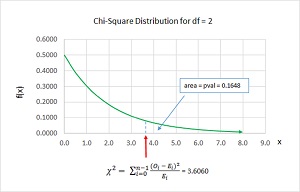
Computing a chi-square statistic is easy but computing the associated p-value is very difficult. The ideas are illustrated in the graph in Figure 2.
 [Click on image for larger view.] Figure 2: The Chi-Square Distribution for the Demo Data
There isn't just one chi-square distribution; there is a different chi-square distribution for each degrees of freedom (df) value. For a chi-square test between observed and expected counts, the df is the number of categories minus one. Therefore, for the demo data df = 3 - 1 = 2.
The x-axis ranges from 0.0 (when observed and expected counts are equal) to infinity (there's no limit on how different observed and expected counts can be). The line that defines the chi-square distribution is called the probability density function (pdf). The p-value is the area under the pdf curve from the chi-square statistic to infinity.
To recap, when observed and expected counts are similar, the computed chi-square statistic will be small (close to 0) and the p-value will be large (close to 1). When observed and expected counts are very different, the computed chi-square statistic will be large and the p-value will be small (perhaps less than 0.05).
There are several algorithms that estimate the area under a chi-square distribution. The demo program uses what is called ACM Algorithm 299. That algorithm calls another algorithm -- ACM Algorithm 209. Here's a small snippet from the demo code function that computes the area under a chi-square distribution:
. . .
if (a > 40.0) {  // ACM remark (5)
  if (even == true) ee = 0.0;
  else ee = 0.5723649429247000870717135; // log(sqrt(pi))
  c = Math.Log(a); // log base e
  while (z <= x) {
    ee = Math.Log(z) + ee;
    s = s + Exp(c * z - a - ee); // ACM update (6)
    z = z + 1.0;
 }
. . .
The point is that estimating the area under a chi-square distribution is conceptually complex, but it's just numerical calculations.
The Demo Program
The complete code for the demo program, with a few edits to save space, is presented in Listing 1. To create the demo, I launched Visual Studio and created a new Console Application and named it ChiSquareUsingCSharp. I specified a .NET Core application, but the code has no dependencies and a .NET Framework application would work fine too.
Listing 1: Complete Demo Program
using System;
namespace ChiSquareCSharp
{
  class ChiSquareProgram
  {
    static void Main(string[] args)
    {
      Console.WriteLine("Begin chi-square test ");

      int[] observed = new int[] { 529, 241, 230 };
      double[] expected = new double[] { 500.0, 250.0, 250.0 };
      Console.Write("Observed counts: ");
      ShowVector(observed);
      Console.Write("Expected counts: ");
      ShowVector(expected);

      double[] result = ChiSqTest(observed, expected);
      double chiStat = result[0];
      double pVal = result[1];
      Console.WriteLine("The chi-square statistic = " +
        chiStat.ToString("F4"));
      Console.WriteLine("The corresponding p-val  = " +
        pVal.ToString("F4"));

      if (pVal < 0.05)
        Console.WriteLine("Strong evidence observed is off ");
      else if (pVal < 0.10)
        Console.WriteLine("Moderate evidence observed is off ");
      else
        Console.WriteLine("Insufficient evidence observed is off ");

      Console.WriteLine("End demo ");
      Console.ReadLine();
    }  // Main

    public static double[] ChiSqTest(int[] observed,
      double[] expected)
    {
      // 1. compute chi-square statistic
      double x = ChiSqStat(observed, expected);
      // 2. compute the p-val
      int df = observed.Length - 1;
      double pVal = ChiSqPval(x, df);
      // 3. return both values
      double[] result = new double[] { x, pVal };
      return result;
    } // ChiSqTest

    public static double ChiSqStat(int[] observed,
      double[] expected)
    {
      double sum = 0.0;
      for (int i = 0; i < observed.Length; ++i)
      {
        sum += ((observed[i] - expected[i]) *
          (observed[i] - expected[i])) / expected[i];
      }
      return sum;
    }

    public static double ChiSqPval(double x, int df)
    {
      // ACM Algorithm #299
      if (x <= 0.0 || df < 1)
        throw new Exception("Bad arg in ChiSqPval()");

      double a = 0.0; // 299 variable names
      double y = 0.0;
      double s = 0.0;
      double z = 0.0;
      double ee = 0.0; // change from e
      double c;

      bool even; // is df even?

      a = 0.5 * x;
      if (df % 2 == 0) even = true; else even = false;

      if (df > 1) y = Exp(-a); // ACM update remark (4)

      if (even == true) s = y;
      else s = 2.0 * Gauss(-Math.Sqrt(x));

      if (df > 2)
      {
        x = 0.5 * (df - 1.0);
        if (even == true) z = 1.0; else z = 0.5;
        if (a > 40.0) // ACM remark (5)
        {
          if (even == true) ee = 0.0;
          else ee = 0.5723649429247000870717135; // log(sqrt(pi))
          c = Math.Log(a); // log base e
          while (z <= x)
          {
            ee = Math.Log(z) + ee;
            s = s + Exp(c * z - a - ee); // ACM update remark (6)
            z = z + 1.0;
          }
          return s;
        } // a > 40.0
        else
        {
          if (even == true) ee = 1.0;
          else ee = 0.5641895835477562869480795 / Math.Sqrt(a);
          c = 0.0;
          while (z <= x)
          {
            ee = ee * (a / z); // ACM update remark (7)
            c = c + ee;
            z = z + 1.0;
          }
          return c * y + s;
        }
      } // df > 2
      else
      {
        return s;
      }
    } // ChiSqPval()

    private static double Exp(double x) // ACM update remark (3)
    {
      if (x < -40.0) // ACM update remark (8)
        return 0.0;
      else
        return Math.Exp(x);
    }

    public static double Gauss(double z)
    {
      // ACM Algorithm #209
      double y; // 209 scratch variable
      double p; // result. called 'z' in 209
      double w; // 209 scratch variable

      if (z == 0.0)
        p = 0.0;
      else
      {
        y = Math.Abs(z) / 2;
        if (y >= 3.0)
        {
          p = 1.0;
        }
        else if (y < 1.0)
        {
          w = y * y;
          p = ((((((((0.000124818987 * w
            - 0.001075204047) * w
            + 0.005198775019) * w
            - 0.019198292004) * w + 0.059054035642) * w
            - 0.151968751364) * w + 0.319152932694) * w
            - 0.531923007300) * w + 0.797884560593) * y * 2.0;
        }
        else
        {
          y = y - 2.0;
          p = (((((((((((((-0.000045255659 * y
            + 0.000152529290) * y - 0.000019538132) * y
            - 0.000676904986) * y + 0.001390604284) * y
            - 0.000794620820) * y - 0.002034254874) * y
           + 0.006549791214) * y - 0.010557625006) * y
          + 0.011630447319) * y - 0.009279453341) * y
         + 0.005353579108) * y - 0.002141268741) * y
        + 0.000535310849) * y + 0.999936657524;
        }
      }

      if (z > 0.0)
        return (p + 1.0) / 2;
      else
        return (1.0 - p) / 2;
    } // Gauss()

    public static void ShowVector(int[] vector)
    {
      for (int i = 0; i < vector.Length; ++i)
        Console.Write(vector[i].ToString() + "  ");
      Console.WriteLine();
    }

    public static void ShowVector(double[] vector)
    {
      for (int i = 0; i < vector.Length; ++i)
        Console.Write(vector[i].ToString("F1") + "  ");
      Console.WriteLine();
    }

  }  // Program
}  // ns
After the template code loaded into the VS editor, I right-clicked on file Program.cs in the Solution Explorer window and renamed the file to ChiSquareProgram. At the VS prompt, I allowed VS to automatically rename the Program class. At the top of the template code, I deleted all namespace references except for the System namespace.
The Main() method begins with:
static void Main(string[] args)
{
  Console.WriteLine("Begin chi-square test ");
  int[] observed = new int[] { 529, 241, 230 };
  double[] expected = new double[] { 500.0, 250.0, 250.0 };
  Console.Write("Observed counts: ");
  ShowVector(observed);
  Console.Write("Expected counts: ");
  ShowVector(expected);
. . .
The observed and expected counts are hard-coded. In a non-demo scenario those values would likely come from some other system that is being monitored. The overloaded ShowVector program-defined functions are just conveniences.
The heart of the program is five statements:
  double[] result = ChiSqTest(observed, expected);
  double chiStat = result[0];
  double pVal = result[1];
  Console.WriteLine("The chi-square statistic = " +
    chiStat.ToString("F4"));
  Console.WriteLine("The corresponding p-val  = " +
    pVal.ToString("F4"));
The ChiSqTest() function returns an array with two cells. Cell [0] holds the computed chi-square statistic, and cell [1] holds the corresponding p-value. The reason for this unusual design is that it mimics the chisquare() function in the Python language SciPy library.
The Main() method concludes with:
. . .
  if (pVal < 0.05)
    Console.WriteLine("Strong evidence observed is off ");
  else if (pVal < 0.10)
    Console.WriteLine("Moderate evidence observed is off ");
  else
    Console.WriteLine("Insufficient evidence observed is off ");

  Console.WriteLine("End demo ");
  Console.ReadLine();
}  // Main
Interpreting the p-value is problem-dependent. A common critical threshold for the p-value is 0.05 -- when the p-value is less than 0.05 there's less than a 5 percent chance that the observed and expected counts are actually equal but the differences were due to sampling chance. However, you can use whatever threshold values make sense for the problem at hand.
Wrapping Up
As is the case with all classical statistical techniques, it's important to understand that results are probabilistic. For the demo problem, even if the computed p-value is very small, there's still a chance that the difference between observed and expected counts was due to random errors that are inherent in all real-life data. Put another way, a small chi-square p-value means, "this data should be examined by a human" rather than, "the observed counts don't match the expected counts."
About the Author
Dr. James McCaffrey directs the data science and research efforts at Quaetrix, a data analytics company located near Redmond, Washington. Before joining Quaetrix, James was a senior research engineer at Microsoft. James can be reached at [email protected].