News
Uno Platform Taps Xamarin for .NET WebAssembly Memory Profiler Support
In its latest update, Uno Platform borrowed some Xamarin tech to add brand-new memory profiler support to .NET WebAssembly.
The open source Uno Platform helps developers create single-source C# and XAML apps that run natively on many platforms. It's a major player in the Microsoft-centric dev space, claiming the only offering that enables development of single-codebase applications for Windows, WebAssembly, iOS, macOS, Android and Linux, targeting all OSes and browsers. It has also teamed up with Microsoft on project such as WinUI 3 and has even beaten Microsoft at its own game in some respects, for example being the first to provide Ahead of Time (AOT) compilation for WebAssembly, the tech behind client-side Blazor.
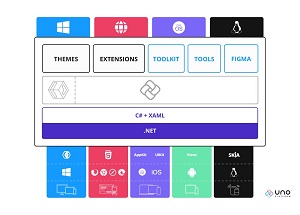 [Click on image for larger view.] Uno Platform 4.0 (December 2021) (source: Uno Platform).
In announcing Uno Platform 4.1 last week with performance gains and support for several new products, the company seemingly one-upped Microsoft again when it comes to WebAssembly memory profiler support.
"Troubleshooting memory issues is not an easy task but can be made more efficient with tooling," said Uno Platform. ".NET WebAssembly is not providing such tooling, but as it uses the Mono virtual machine underneath, tools found in the Xamarin space can be used given the right input."
Indeed, Microsoft documentation for Xamarin Profiler says: "Historically, Mono has featured a powerful command-line profiler for gathering information about programs running in the Mono runtime called the Mono log profiler. The Xamarin Profiler a graphical interface for the Mono log profiler, and supports profiling Android, iOS, tvOS, and Mac applications on Mac, and Android, iOS, and tvOS applications on Windows."
Thus, Uno Platform said, "We took the task of enabling memory profiling for WebAssembly, by including the mono logging profiler in the runtime, giving the ability to create memory profiles that can be opened using the Xamarin Profiler."
That resulted in this:
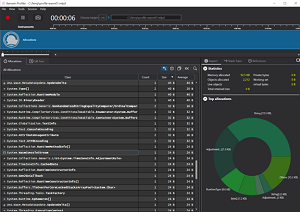 [Click on image for larger view.] The Memory Profiler (source: Uno Platform).
In other news, performance updates were effected across a variety of constructs in the platform, as mentioned.
"For this release, we've made numerous changes to a wide range of parts from the Uno Platform, such as Style resolution, layout and measure pass performance, memory consumption and allocations which result in up to 30 percent performance improvements in some scenarios," the company said.
Other highlights of Uno Platform 4.1 include support for for Android 12 SDK and its dependencies, and the removal of support for Android 10 SDK.
Also new is support for recent Microsoft dev tooling bits, specifically .NET 6 Mobile Preview 13 and VS 2022 17.2 Preview 1.
"The .NET team has introduced the Preview 13 of their mobile bindings, introducing a set of low-level breaking changes in the macOS and iOS APIs," the announcement post said. "This change is unlikely to impact most net6 Uno applications, but libraries that make use of the 'native' primitives such as 'nint' and 'nfloat' will require some code changes."
Furthermore, the integration with Visual Studio Code plugin that was introduced in the December release of Uno Platform v.4.0 was enhanced in two ways:
- Improvements over code changes detection, so that code completion shows up-to-date content from code in an application
- The ability to set a port number in the remote-control tooling, which can be particularly useful when publishing an application in a container
The announcement post includes many more details on all of the above and more. Overall, the new release comes with more than 200 new feature requests, bugs and issues raised by the community, which now includes more than 210 contributors, Uno Platform said.
About the Author
David Ramel is an editor and writer at Converge 360.