News
Edge Browser Tests Experimental DevTools Command Palette
A new experimental Command Palette is available for testing in the bleeding-edge Canary channel for daily builds of the Microsoft Edge web browser.
It works similarly to the Command Palette in Visual Studio Code, bringing up a menu of commands with a three-stroke key combination, though it's a different combination from the one used in VS Code.
"Command Palette makes it possible to quickly access browser management and developer tools features with just one keyboard shortcut: Ctrl+Shift+Space," Microsoft said in a July 19 post. "Press the shortcut and get access to tab, bookmark, and collection management features, or developer tools features like simulating a mobile device, clearing the cache memory, and more. If you are familiar with other command palettes like the one in VS Code, or PowerToys, you will feel right at home."
The new Command Palette experiment feature that originated from a June 21 GitHub issue acts as a shortcut to help developers quickly access productivity and developer-oriented features that normally would require clicking through several menus or using a series of keyboard shortcut commands. It lets developers run DevTools commands without having to open DevTools first with a Ctrl+Shift+I command.
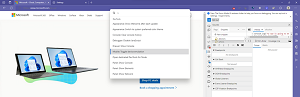 [Click on image for larger view.] DevTools Command Palette (source: Microsoft).
Command examples listed by Microsoft include open the Device Emulation tool, create and access snippets and manage browser tabs.
Generally, Edge DevTools help developers do the following:
- Inspect, tweak, and change the styles of elements in the webpage using live tools with a visual interface. Inspect where the browser stored content to construct the webpage, including .html, .css, .js, and .png file formats.
- Emulate how your website behaves on different devices and simulate a mobile environment, complete with different network conditions. Inspect the network traffic and see the location of the problems.
- Debug your JavaScript using breakpoint debugging and with the live console. Find memory problems and rendering issues with your web apps.
- Find accessibility, performance, compatibility, and security issues in your products, and use DevTools to fix the accessibility issues that are found.
- Use a development environment to sync changes in DevTools with the file system and from the web.
The experimental feature is available in Canary builds starting with v105.
About the Author
David Ramel is an editor and writer at Converge 360.