Inside TFS
Exploratory Testing in TFS 2012
Learn how Visual Studio 2012 makes exploratory testing quick and easy.
Previous Inside TFS columns have talked about test plan and test case management in TFS 2010. That process is sometimes referred to as formal test case management, in that you start with a list of requirements, write a series of test cases to validate those requirements, then run the test cases. This process works well, but it can become cumbersome to author and maintain test cases for every possible scenario for the system under test.
Another branch of testing, called exploratory testing, allows testers to spend time being creative in trying to find bugs. They do not follow any formal test plan, but instead attempt to break the application in whatever manner they choose. This can lead to finding a wide variety of bugs that formal test case management may not cover.
One problem with exploratory testing is that the tester doesn't always remember the exact steps performed leading up to encountering the bug, which can lead to bugs that aren't well documented. Visual Studio 2012 and Team Foundation Server have overcome this problem, as well as others around exploratory testing, by building top-level support for exploratory testing into Microsoft Test Manager. Testers can use Microsoft Test Manager to capture each step the tester performs, capture bugs when discovered, and automatically create test cases for future regression testing.
To get started with exploratory testing, open Microsoft Test Manager, shown in Figure 1.

[Click on image for larger view.] |
| Figure 1. Use Microsoft Test Manager to start an exploratory testing session. |
At the top of Test Manager, select the Test menu option to display the Test page. In the sub-menu, select Do Exploratory Testing to open the exploratory testing page. From here, you can click the Explore button to start an ad-hoc exploratory session. You can also select a work item, and then click the Explore Work Item button. Selecting a work item has the benefit of taking your test results and automatically associating them with that work item. This will also be true for any bug work items that are opened. By default, the only work items listed are the requirements for the current test plan iteration, though this can be modified.
Once you start your testing session, the Test Runner application opens. Click the Start button in the Test Runner to start the exploratory testing session. While you're exploring the application, Test Runner collects data, based off the test settings. The main difference in this sort of testing, as opposed to standard manual testing in Visual Studio 2012, is that Test Runner doesn't provide a list of steps for you to test with. Instead, you perform whatever tests you want, while data is collected behind the scenes.
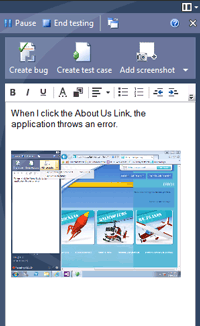
As you find issues, you can collect screenshots and enter information about the bug, as shown in Figure 2.

[Click on image for larger view.] |
| Figure 2. Bug information entered by the tester into Test Runner. |
In the example in Figure 2, an issue has cropped up with the About Us link on the Web site under testing. When that happens, enter a description of the potential bug in the Test Runner window. Next, click the Add screenshot button to take a screenshot of the error message. This screenshot automatically appears in Test Runner.
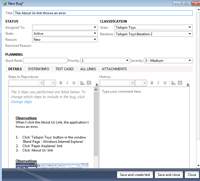
To file a bug in Team Foundation Server concerning this issue, click the Create bug button at the top of Test Runner. This pauses Test Runner and opens the New Bug form, shown in Figure 3.

[Click on image for larger view.] |
| Figure 3. Creating a new bug. Notice how all the steps performed during testing are displayed automatically. |
The first thing to notice is that all the steps performed since starting the testing session are listed in the bug automatically. This makes it easier in the future to recreate the bug, as well as confirm the bug has been fixed.
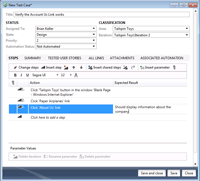
Once you're done filling out the form, you can save and close the form, but you can also create a test case for this bug by clicking the Save and create test button. Clicking this button opens the New Test Case form, shown in Figure 4. Creating a test case in this fashion is suggested, to ensure that you have a test case to verify the bug you just created has been fixed.

[Click on image for larger view.] |
| Figure 4. Creating a new test case from the exploratory testing data. |
Notice in Figure 4 how the test case is automatically pre-populated with the steps performed earlier in the testing session. This list of steps is modifiable (in Figure 4, the expected result has been added to the test), allowing you to create a more detailed test case for future use. Once you've finished creating your test case, click the Save and close button.
At this point you can continue your exploratory testing. To clear everything that's been recorded to that point, select everything in Test Runner and press the Delete button to remove the data. Once you've finished your testing session, click the End testing button at the top of the Test Runner to close Test Runner and return to Test Manager.
Exploratory testing is a valid way to find bugs in your applications. Visual Studio 2012 and Team Foundation Server 2012, with their ability to capture data around exploratory testing, make this branch of testing much more appealing, to both testers and management.
About the Author
Mickey Gousset spends his days as a principal consultant for Infront Consulting Group. Gousset is lead author of "Professional Application Lifecycle Management with Visual Studio 2012" (Wrox, 2012) and frequents the speaker circuit singing the praises of ALM and DevOps. He also blogs at ALM Rocks!. Gousset is one of the original Team System/ALM MVPs and has held the award since 2005.